$IR – POTENTIAL REVERSAL AT EXTREME DEMAND 🚀
Based on Multiple Time Frame analysis, $IR is currently in a crucial area. Although the Daily (D1) trend is still dominated by Sellers, we are seeing early signs of a potential reversal on smaller timeframes.
Technical Highlights:
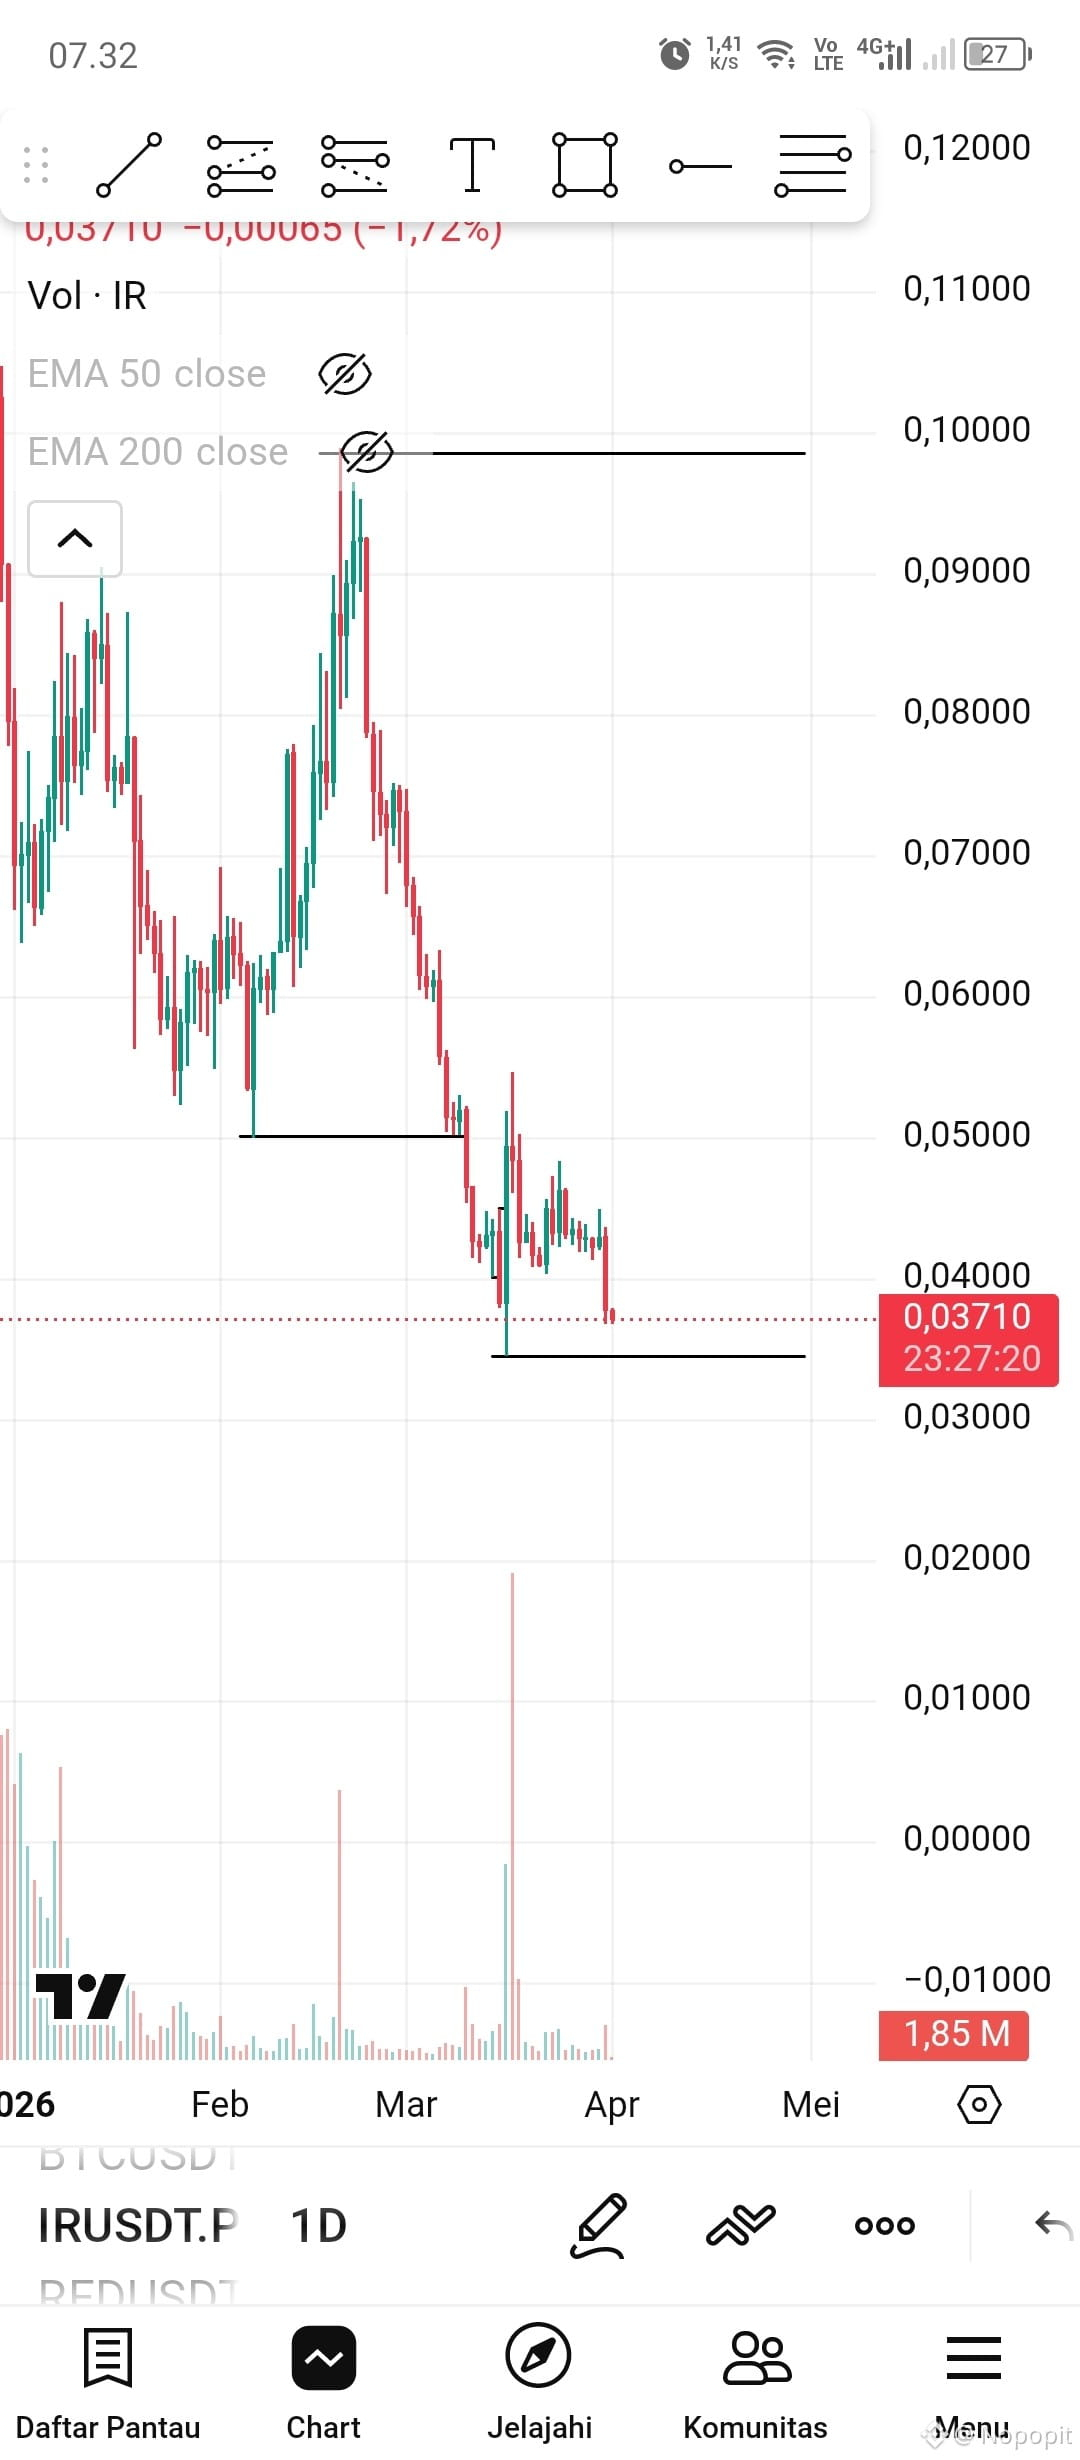
D1 Chart: The price has formed a Bullish Engulfing pattern, indicating accumulation at lower levels.
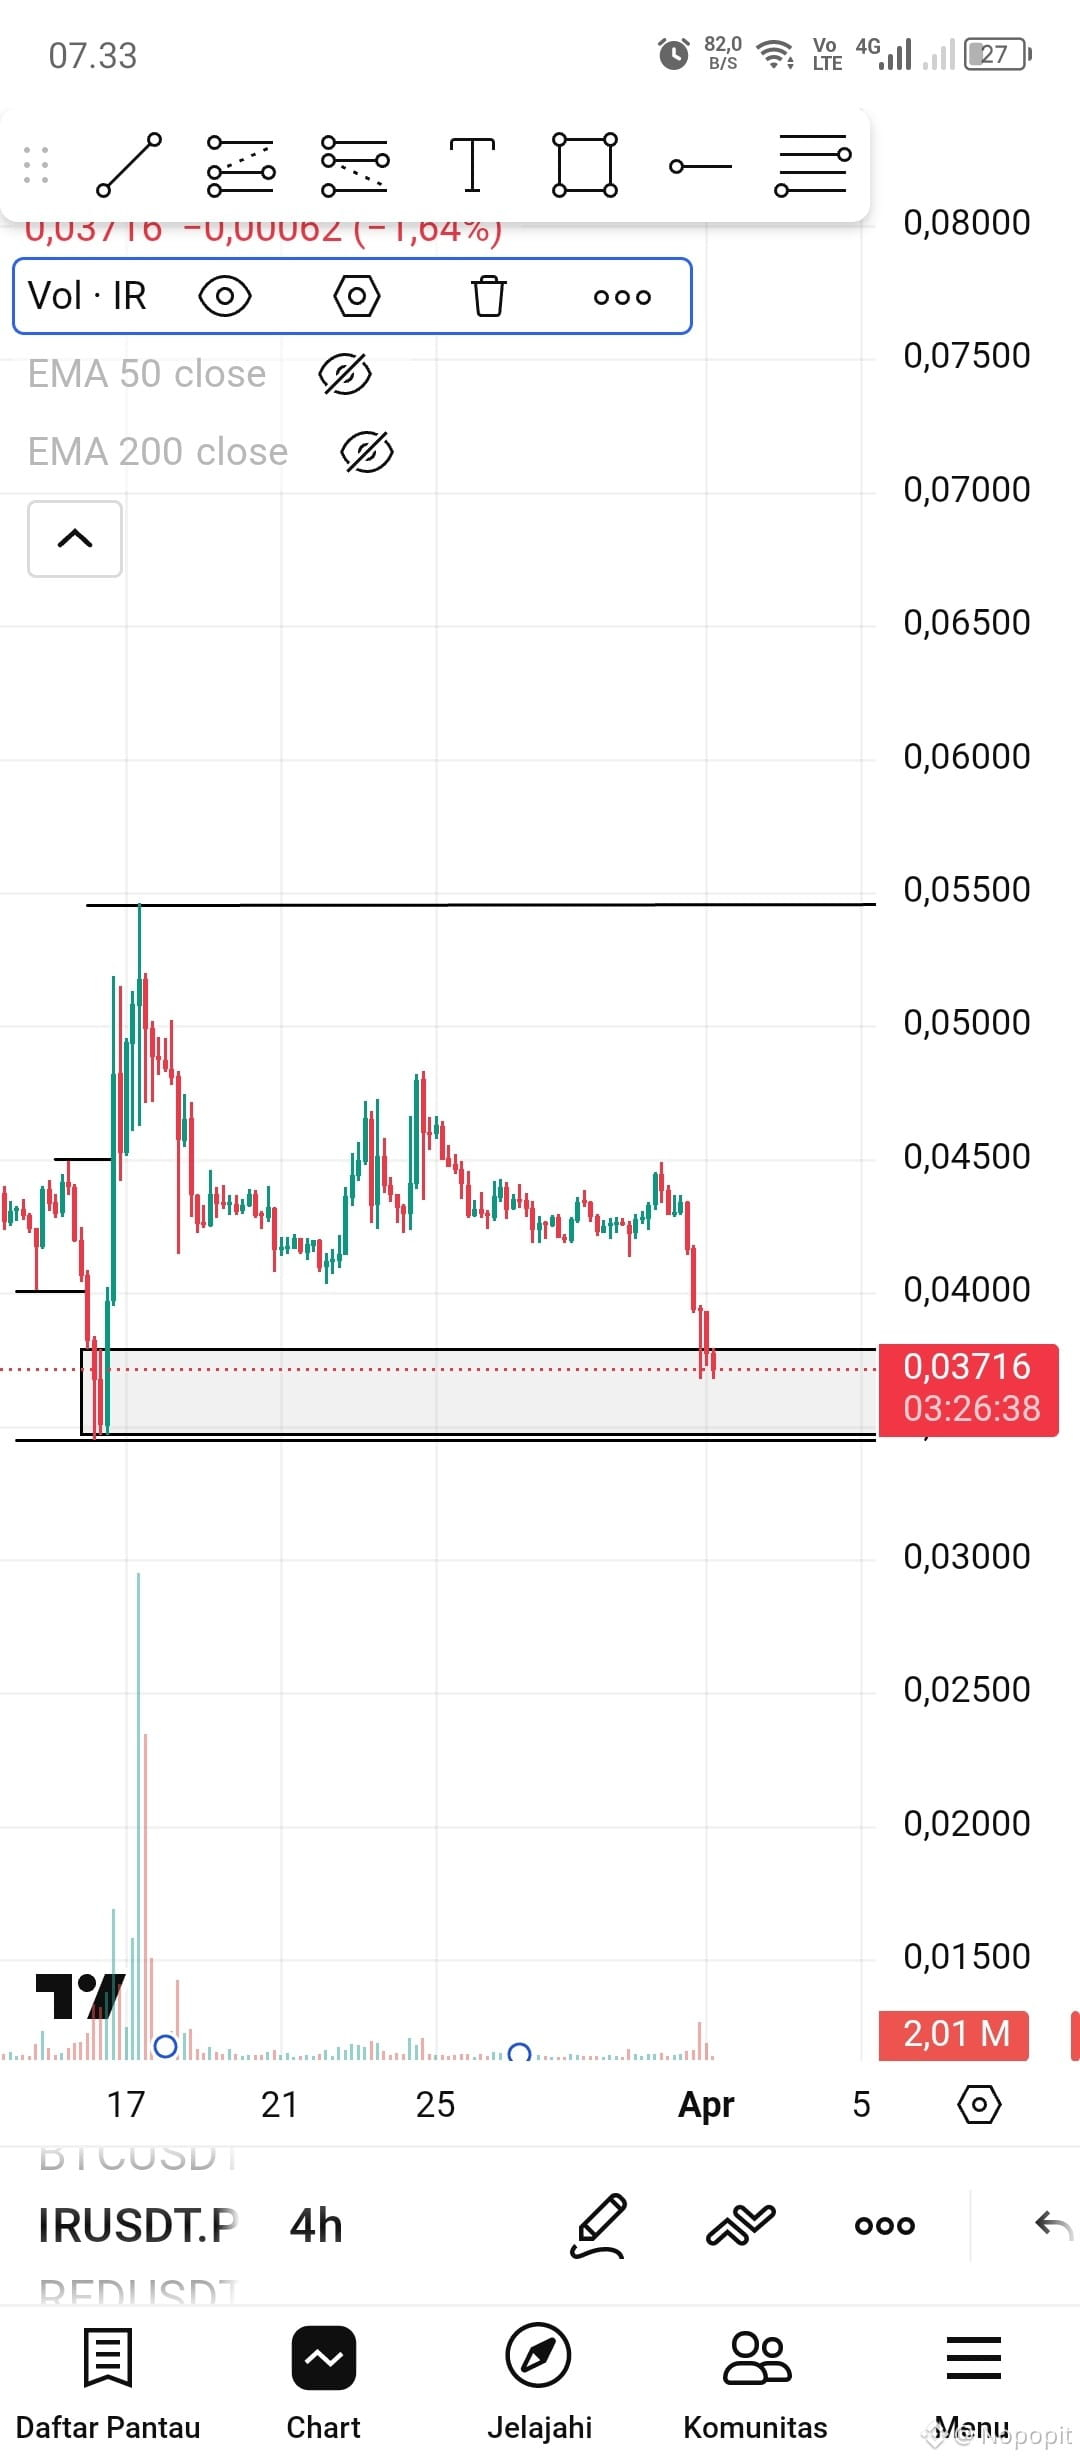
H4 Chart: A CHoCH (Change of Character) has occurred! This is an early technical signal that the bearish structure is beginning to break. The price is currently retesting at the Extreme Order Block.
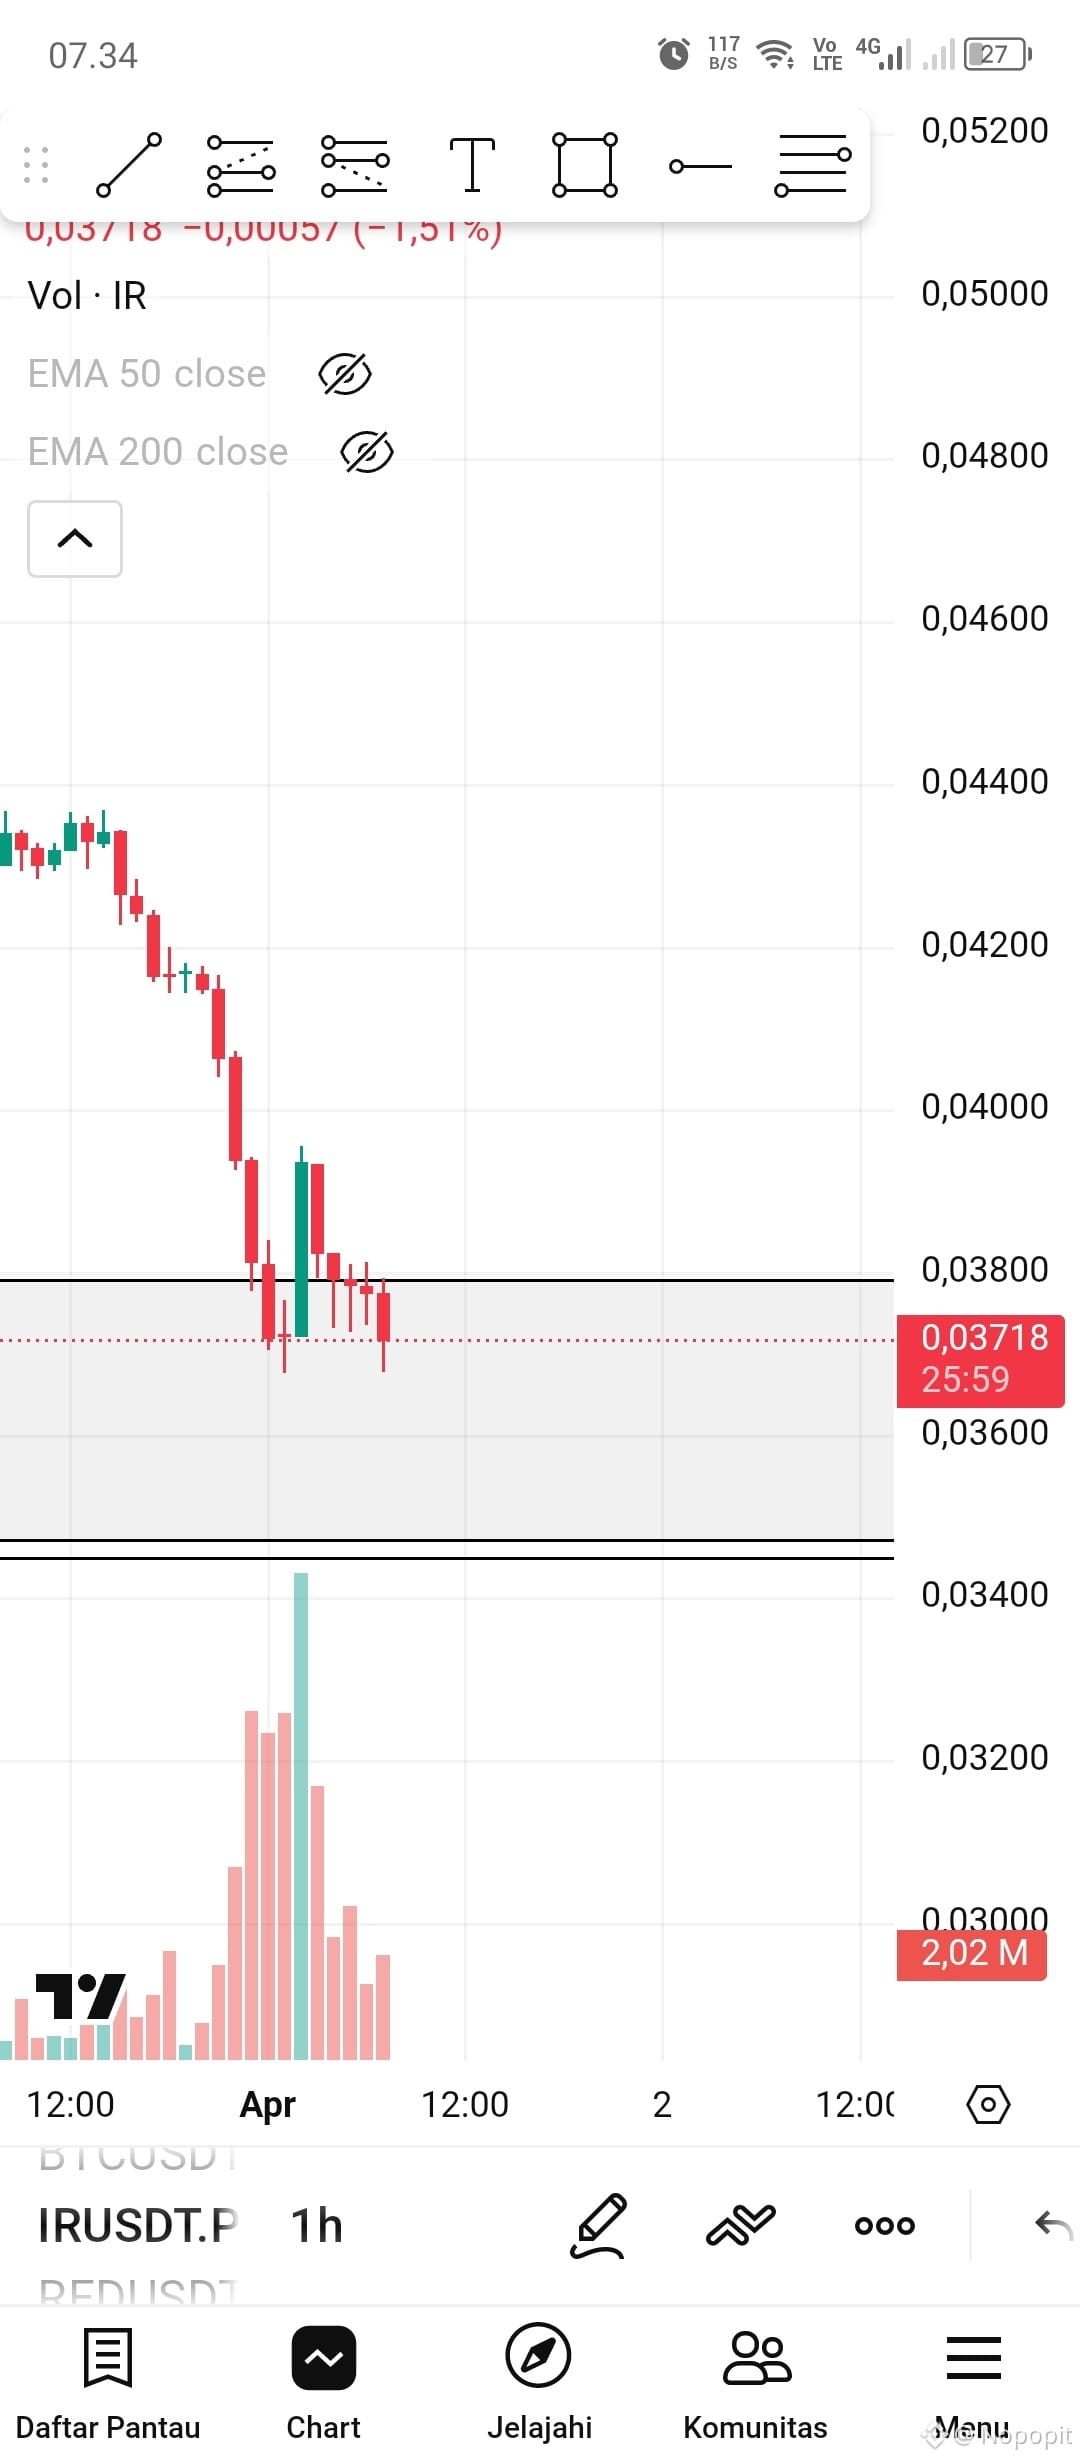
H1 Chart: Buyers are starting to enter (Bullish candle), but sellers are still trying to push down. This area is the last "battleground."
📌 TRADING PLAN (Long Position)
Entry Zone: $0.03449 - $0.03750 (Wait for confirmation of a bounce on H1/M15)
(Use strict risk management!)
🎯 Take Profit (TP):
TP 1: $0.04494
TP 2: $0.04832
TP 3: $0.05457
🛑 Stop Loss (SL):
SL: $0.03250 (Below the H4 Demand zone)
Wait for rejection or long wicks in the entry area before executing. Do not force entry if the price breaks the $0.0325 level with high volume.
Share your thoughts about $IR in the comments section 😁.
s#GoogleStudyOnCryptoSecurityChallenges
Based on Multiple Time Frame analysis, $IR is currently in a crucial area. Although the Daily (D1) trend is still dominated by Sellers, we are seeing early signs of a potential reversal on smaller timeframes.
Technical Highlights:
D1 Chart: The price has formed a Bullish Engulfing pattern, indicating accumulation at lower levels.
H4 Chart: A CHoCH (Change of Character) has occurred! This is an early technical signal that the bearish structure is beginning to break. The price is currently retesting at the Extreme Order Block.
H1 Chart: Buyers are starting to enter (Bullish candle), but sellers are still trying to push down. This area is the last "battleground."
📌 TRADING PLAN (Long Position)
Entry Zone: $0.03449 - $0.03750 (Wait for confirmation of a bounce on H1/M15)
(Use strict risk management!)
🎯 Take Profit (TP):
TP 1: $0.04494
TP 2: $0.04832
TP 3: $0.05457
🛑 Stop Loss (SL):
SL: $0.03250 (Below the H4 Demand zone)
Wait for rejection or long wicks in the entry area before executing. Do not force entry if the price breaks the $0.0325 level with high volume.
Share your thoughts about $IR in the comments section 😁.
s#GoogleStudyOnCryptoSecurityChallenges