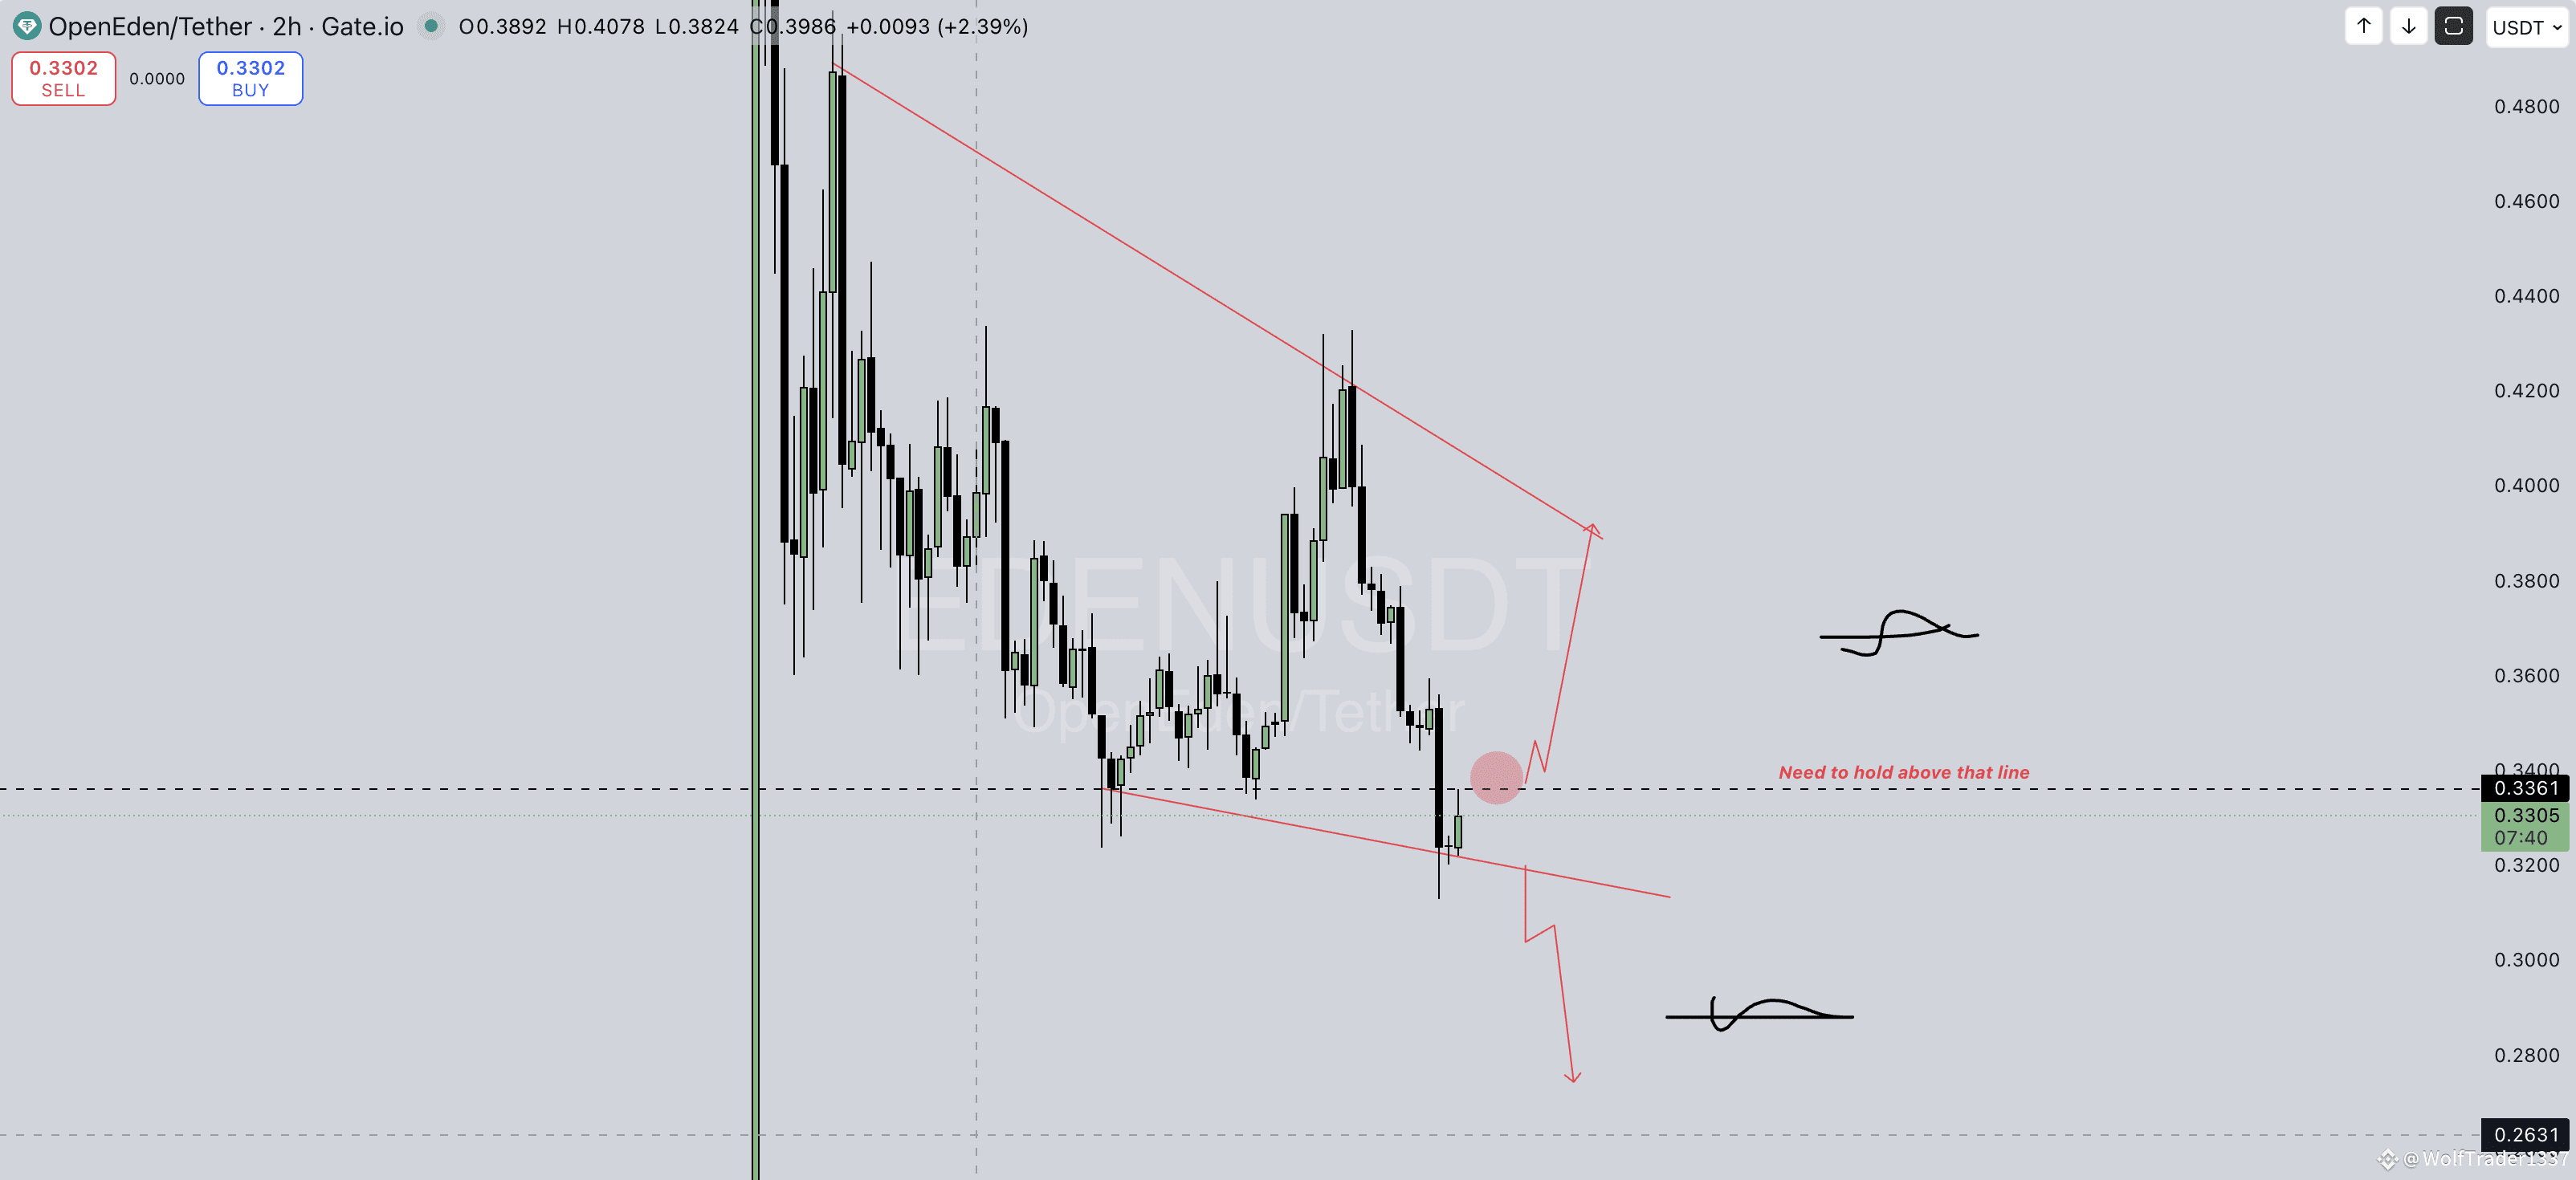
🔍 Chart Overview
Pattern: Falling wedge / descending channel — typically a potential reversal pattern.
Key Level: Around 0.336 (marked “Need to hold above that line”).
Current Price: ~0.33 USDT.
📈 Bullish Scenario
If price holds above 0.336 and confirms support, it could break the wedge upward.
Possible targets:
First: 0.38
Next: 0.42–0.46
Volume confirmation is important — breakout with low volume may be fake.
📉 Bearish Scenario
If it fails to hold 0.336 and drops below the lower red line →
Next downside zones: 0.30 → 0.27
✅ In short (not financial advice):
OpenEden is sitting at a key support. Holding above 0.336 = bullish bounce likely. Losing it = short-term bearish continuation.
#KlinkBinanceTGE #BNBBreaksATH #WhaleWatch $