

If you are an active trader, you probably know that entering a trade is easier than exiting it. Or when the position is in profit and you are driven by greed and want to earn more. or when the deal is at a loss and it is difficult for you to close it.
In this article, we will look at the various factors you should consider when entering and exiting trades. This will help you in your trading.
You can consider this as a follow-up to the Risk Management article, so be sure to read it if you haven't read it.
As I mentioned earlier, entering a trade is often the easiest part and the ability to exit a position on time separates those who make money from trading and those who do not.
Let's assume that you found the ideal entry point and entered into a trade, from where the price made a reversal. However, if you cannot manage your trades, you may still either lose money or exit a trade too early for fear of losing potential profits.
In this article we will assume that you are trading with a stop loss and take profit.
Is it possible to trade without them?
Yes, but if you trade without a stop loss, you are playing a pretty dangerous game and things can quickly go south.
Trading without stops is definitely for seasonal traders who typically scale their positions and know what they are doing.
There are two main benefits of using stop losses for every trade you make.
Firstly, when you focus on lower time frames, you usually open larger positions due to leverage, as you want to capture small price movements.
It's only a matter of time before you take a trade that bounces very strongly against you right after you take it.

Suddenly you are incurring a significant loss, hoping the market will return to your entry so you can at least break even.
This is where experienced traders who don't use a stop loss should take the hit and cut the position.
Inexperienced traders often start to scale by risking much more than they originally planned. Especially during important news, the price may move against you in one direction and end up liquidating your entire account.
There are situations when the stop loss is not so significant. However, they often rely on more fundamental beliefs associated with investing or using strategies such as dollar cost averaging, essentially a type of trading where you are absolutely confident in an asset and want to build a position over a longer period, and your trade invalid only when that fundamental belief is no longer valid.
The second reason I'm always a proponent of using stop losses is that you can tell right away how much money you'll lose if the trade goes against you, and how much you'll make if it hits your take profit.
The level of profit taking is not so important for the setup, since many trend-following strategies work based on trailing stops, rather than at one predetermined level.

While this is a very simplified way to look at the market, if you look at the chart above your setup, the process should look something like this:
Bitcoin looks very good, breaks through the supply zone and consolidates above it. Next, I see a setup in which the price should make a small correction to the local demand zone. Next, I see from above that we have a past balance and several zones such as val 18700 and poc 19150. If the price goes below the demand zone, then my idea is wrong. In this case, I receive a loss of 1% of the trading account ($1000), but if I am right, the risk-to-reward ratio is 10RR. This means that as soon as the price reaches my take profit, I will earn $10,000 in profit.
Even if you don't use a fixed take profit level and decide to track your stop loss based on price changes, moving averages or anything else, you are entering the trade with a fixed idea, and the most important thing is that you know which position you are in more you don't want to be there.
In November 2021, the general consensus on Twitter was that Bitcoin is the best thing that has ever existed and is on its way to 75k, 100k, 250k, and so on.
This often leads to inexperienced people viewing cryptocurrency as an investment and starting to buy without thinking about any invalidity.

As of this writing, Bitcoin is down about 77% from its all-time high.
Even if you avoided leverage trading and weren't liquidated, your $10,000 investment is now worth $2,300 and it may take you several years to see any profit, if ever.
When it comes to the markets, people tend to think they know everything, but the longer you stay in a position, the more and more you are exposed to uncertainty due to all the geopolitical events and news coming your way.
Therefore, risk management should always be your main goal in trading.
Correlation
The other part of the conventional wisdom is that you need diversification.
It's essentially the same thing no matter what market you're trading in. Cryptocurrency, stocks, metals and forex have the highest inter-market correlations.
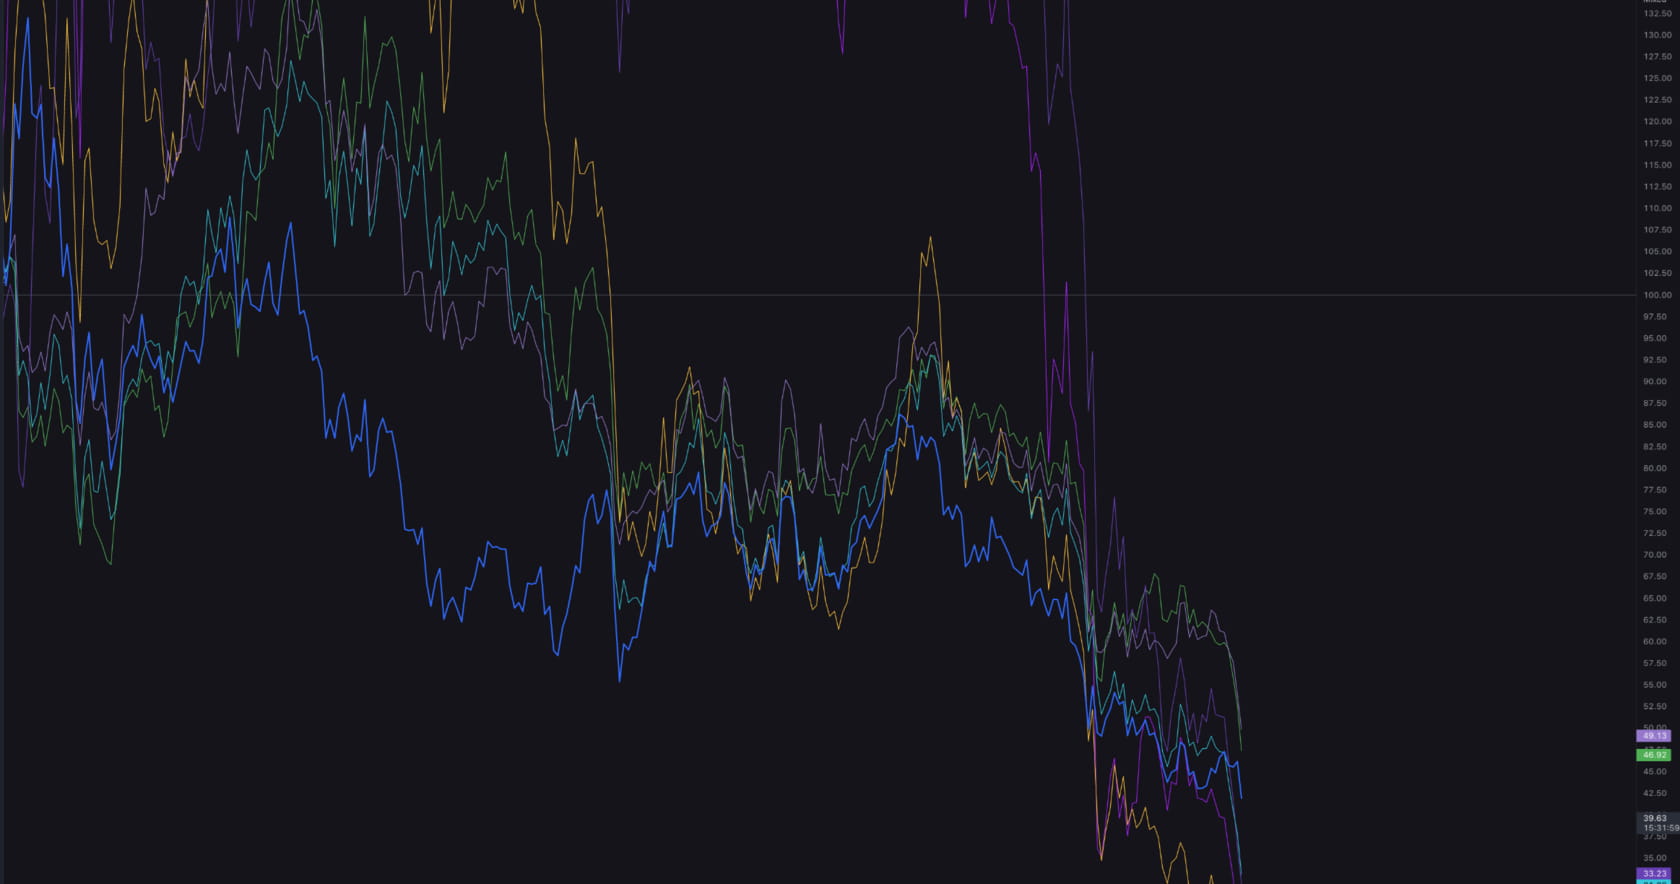
If you look at the chart above, the different colored lines represent other crypto coins.
Without seeing their names, you can't tell what you're looking at, only because they all follow very similar paths.

As you can see in the correlation matrix, correlations in cryptocurrency always approach one, which means almost 100% correlation.
So if you "diversify" across different projects, you are still just trading the same market with a small difference, which means the % changes due to the available liquidity in the market.
Theoretically, if you buy Bitcoin and Solana, and Bitcoin goes up 50%, Solana could go up 100%.
It's not because Sol is better in any form; it simply means there is less liquidity in the market. Therefore it is easier to move it higher.
The same goes for the reverse side; a 10% drop in Bitcoin would cause altcoins to drop by a factor of two or more.
Again, this is due to the available liquidity in the market.

Of course, this is not the only case in cryptocurrency; if you look at the major Forex currencies, you will see that they are all traded against the US dollar.
The correlation between EURUSD and GBPUSD is almost 100%.
If you go long in both of these markets, you are expressing the view that the US dollar will be weaker; if there is any news that causes the US dollar to strengthen, there is a high probability that both of these positions will end up going against you.
Understanding the correlation in the markets you trade is key to managing your risk so you don't lose more money than expected.
Trading expectations and timeframe
One common mistake people tend to make is entering trades with the wrong expectations when it comes to the holding period.

You can see how we are testing the poc zone and waiting for a reaction for the price to go down.
Most traders who would pay attention to this level would open a short position, but after a few hours after the price did not fall, they would close the trade.
This is because they come into trading with the wrong expectations.

You must understand that price is fractal; the same behavior on a monthly chart will occur equally on a weekly, daily, 4-hour and 1-minute chart.
The main difference between higher and lower time frames is the market movers.
On lower time frames, markets are mostly driven by speculators and established players; therefore, it is more important to pay special attention to things like price movement, order flow, and so on.
This is beyond the scope of this article, but I cover these issues in detail in the training.
On the other hand, higher time frames are determined by fundamentals and macroeconomic events.
Plan to hold the trade for a long period. Beyond the levels, you should have a thorough understanding of the fundamentals, be it the US economic growth or the upcoming Bitcoin halving.
But no matter what timeframe you're trading on, you always need to know when to exit a trade if it goes against you.
Opening a trade on the 5-minute chart should also be managed on the 5-minute chart; if you open a trade based on the daily chart, you must also manage it on the daily chart.
Many people emphasize specific time frames, but it doesn't really matter, and I explained why in the Price action article.
The important thing is to find what works for you and stick with it.
Let's say you enter a trade on the daily chart after making a small profit you start to get scared by what you see on the 15 minute chart, this is as bad as entering a trade on the 1 minute chart and immediately moving to the 4 hour chart and trying to pick a take -profit with an unrealistic goal.
Hedging
As I mentioned, a lot of conventional wisdom about cryptocurrency tells you to stay away from leverage and derivatives at all costs.
When used correctly, derivatives can be excellent products not only for directional trading, but also for hedging.
If you don't know what hedging is, it is opening a new position to offset potential losses in an existing trade.
The cryptocurrency is currently facing difficult times in the depths of a bear market and is trading at around $20,000.

Some traders may think that this is a great place to buy Bitcoin, and since they are trading on the spot market, they are not worried about setting any stop losses or protecting their capital.
Let's see if you can be a little smarter about this situation.
You bought 1 BTC for $20,000 and want to protect your trade by not using a stop loss to avoid losing out on volatility.
What you can do is a long put option on 1BTC that expires at the end of the year, meaning your position is protected for the next four months.
Let's look at two scenarios in which Bitcoin rose 50% from $20,000 in those four months.

In the first example, Bitcoin is trading at $10,000 at the end of the year, which means you were wrong in your original idea of buying 1BTC for 20k.
But buying a put option means you make money as long as the underlying price goes down.
Even though you got your initial trading idea wrong, Bitcoin went down 50% and you lost $10,000, but your 1BTC option made $7,450, meaning your total loss is $2,550.
It's much better than losing $10,000.
If Bitcoin reaches $30,000, your put option will lose approximately $7,500.
This will increase your total profit to $4,000 instead of $10,000.
Of course, making $4,000 instead of $10,000 isn't great, but compared to when the price goes against you and you're just glad to be hedged, when the trade goes in your favor, traders tend to close options much earlier or reduce the size.
Options are great hedging products, and so I could give a simple example.
Vertical and horizontal option spreads are viral hedging strategies. If you want to learn more about them, there are many resources online.
Position management
Opening a trade is relatively easy; you just press a few buttons and suddenly you're in a trade.
The real work begins when you are trading.
Whenever you engage in trading, your first priority should be to protect your shortcomings.
The advantage in any trading system does not depend on the trading result, but on a large series of works.
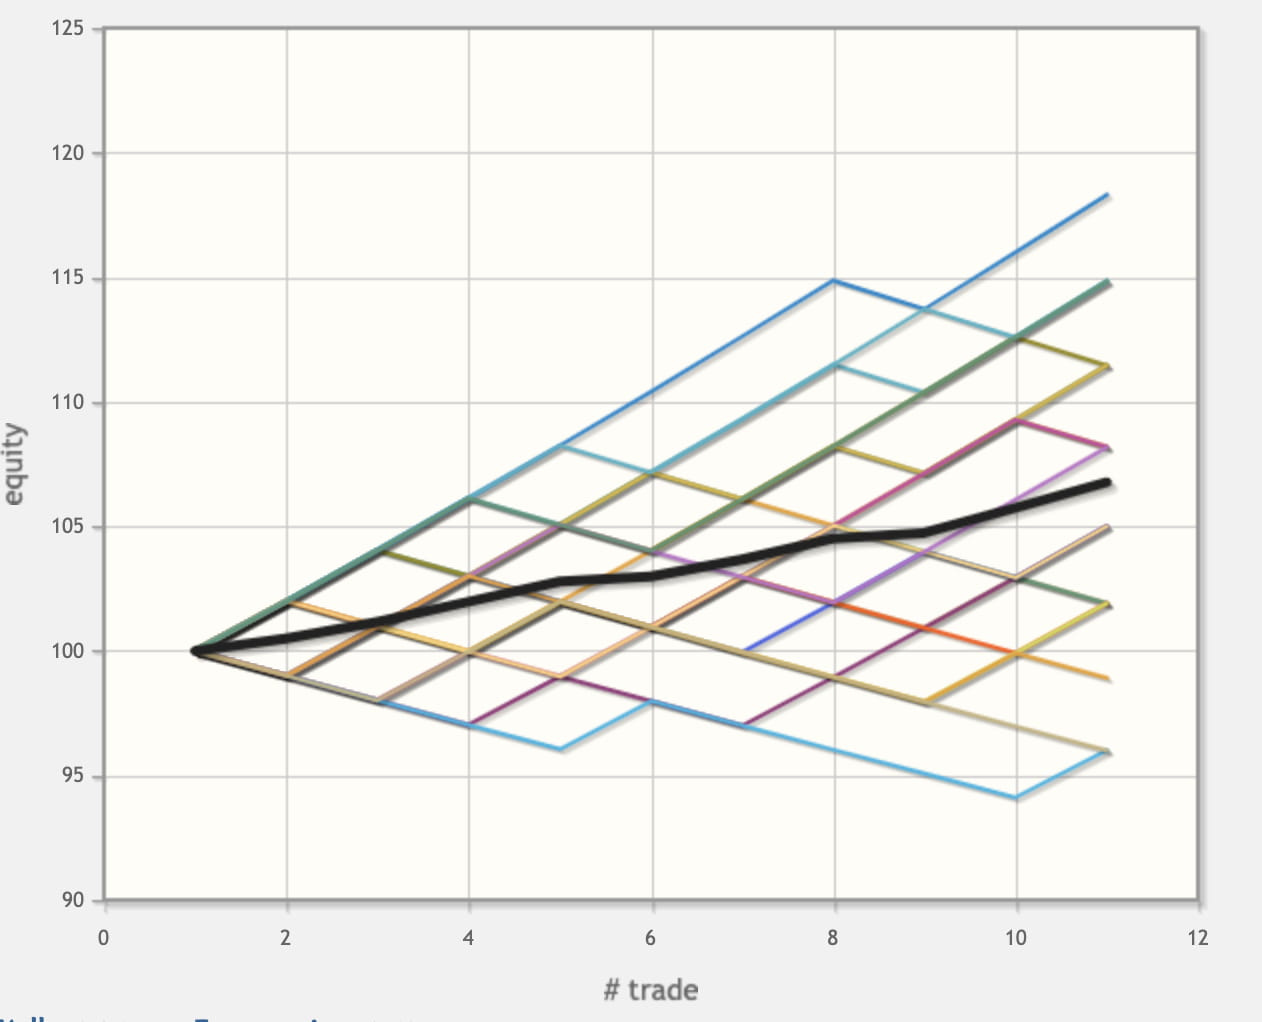
Once again, this is easy to demonstrate with an equity curve simulator.
If we take a simple strategy with a 50% win rate and a 2:1 reward to risk ratio, you may notice that the equity after ten trades is quite random.
Some simulations end in profit, some in loss.
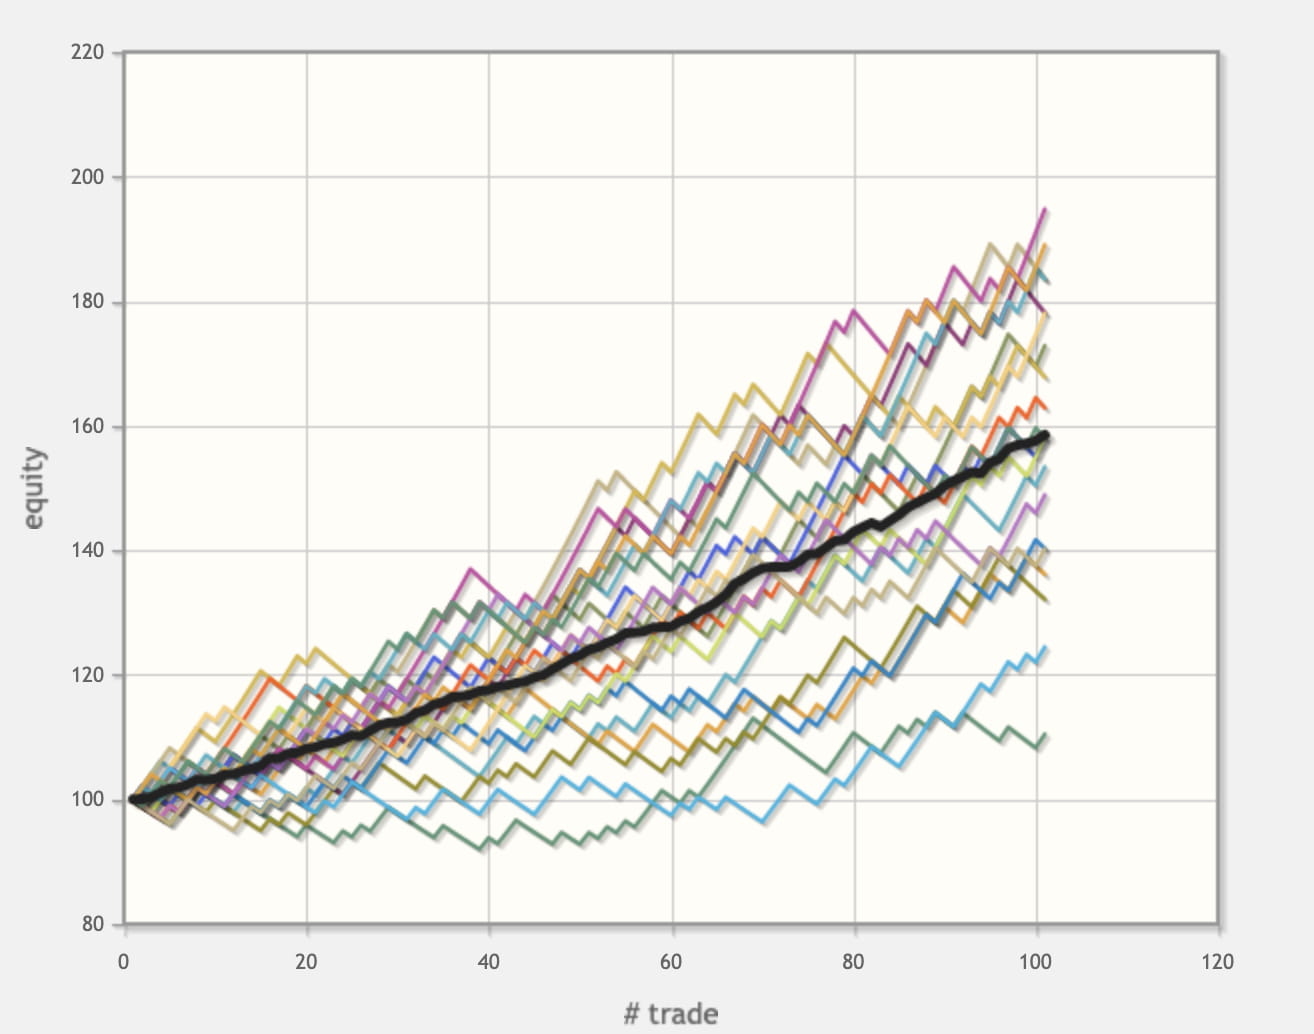
If we build the same strategy for 100 trades, the results will be very different and all equity simulations will result in profit.
As I mentioned, trading with a stop loss is not mandatory, but is highly recommended for most people.
In the article on risk management, I talked about the basic aspects of trade management, such as the use of stop loss, the evolution of R, breakeven and partial profit taking.
Something I haven't considered is pyramiding.
Pyramiding
Pyramiding is the process of increasing the size of successful trades.
This should be well thought out, you can increase your winnings in trending conditions if done correctly.
The key to proper pyramiding is to not add risk to your overall position and to only use profits as additional risk.

If we look at this bitcoin trade for example, you will see that the risk reward on this trade is 6:1.
If you risk $1,000 and the trade hits your target, you will earn $6,000.
Let's now look at how pyramiding can affect this position.

Once the trade breaks the first support and resistance level, you will make a profit of 2R, or in other words, $2,000. You can now add to your position and move your stop loss to the new invalidity level marked on the chart. If the market hits your stop loss, (17200) you will lose $2000 from your unrealized PnL. As the trade progresses, you make another 1R profit, hence another $2,000. You will open a new trade again when retesting, risking $4,000 from uPnL. When the trade hits the target, the ending position reaches 5R or in other words $19,000. This is a huge difference from the initial profit of $6,000. Of course, this was the ideal scenario where everything goes as usual. In many cases, the market will hit your stop and you will lose all of your potential profit; you can't pyramid every trade.
Pyramiding should only be done on high confidence trades backed by your trading journal and experience. Also, as mentioned, when you pyramid, you should never risk more than your initial risk unit.
Conclusion
Many people enter the financial markets seeing quick profits and easy earnings; they will find out very quickly how wrong they were. Managing your trades and protecting your capital should always be your top priority when speculating in the financial markets. Always cover your risks by having realistic expectations for each position. If you can manage your trades correctly, you will continually grow your account, but will also be able to catch a lot of money when the conditions are right.
#training#riskmanagement#management#risks#pyramiding#hedging #correlation