

ETH is currently at a critical node of multi-cycle divergence! (Combining top indicators like RSI, MACD, VPIN, imbalance, funding rates, etc.) Provides precise probability judgment: neutral oscillation in the short to medium term, strong downtrend warning in the long term!
The 1D level candlestick chart below clearly shows that ETH has continuously retraced from high positions, with obvious bearish signals on the technical front (dominant red candles, death cross trend of moving averages)
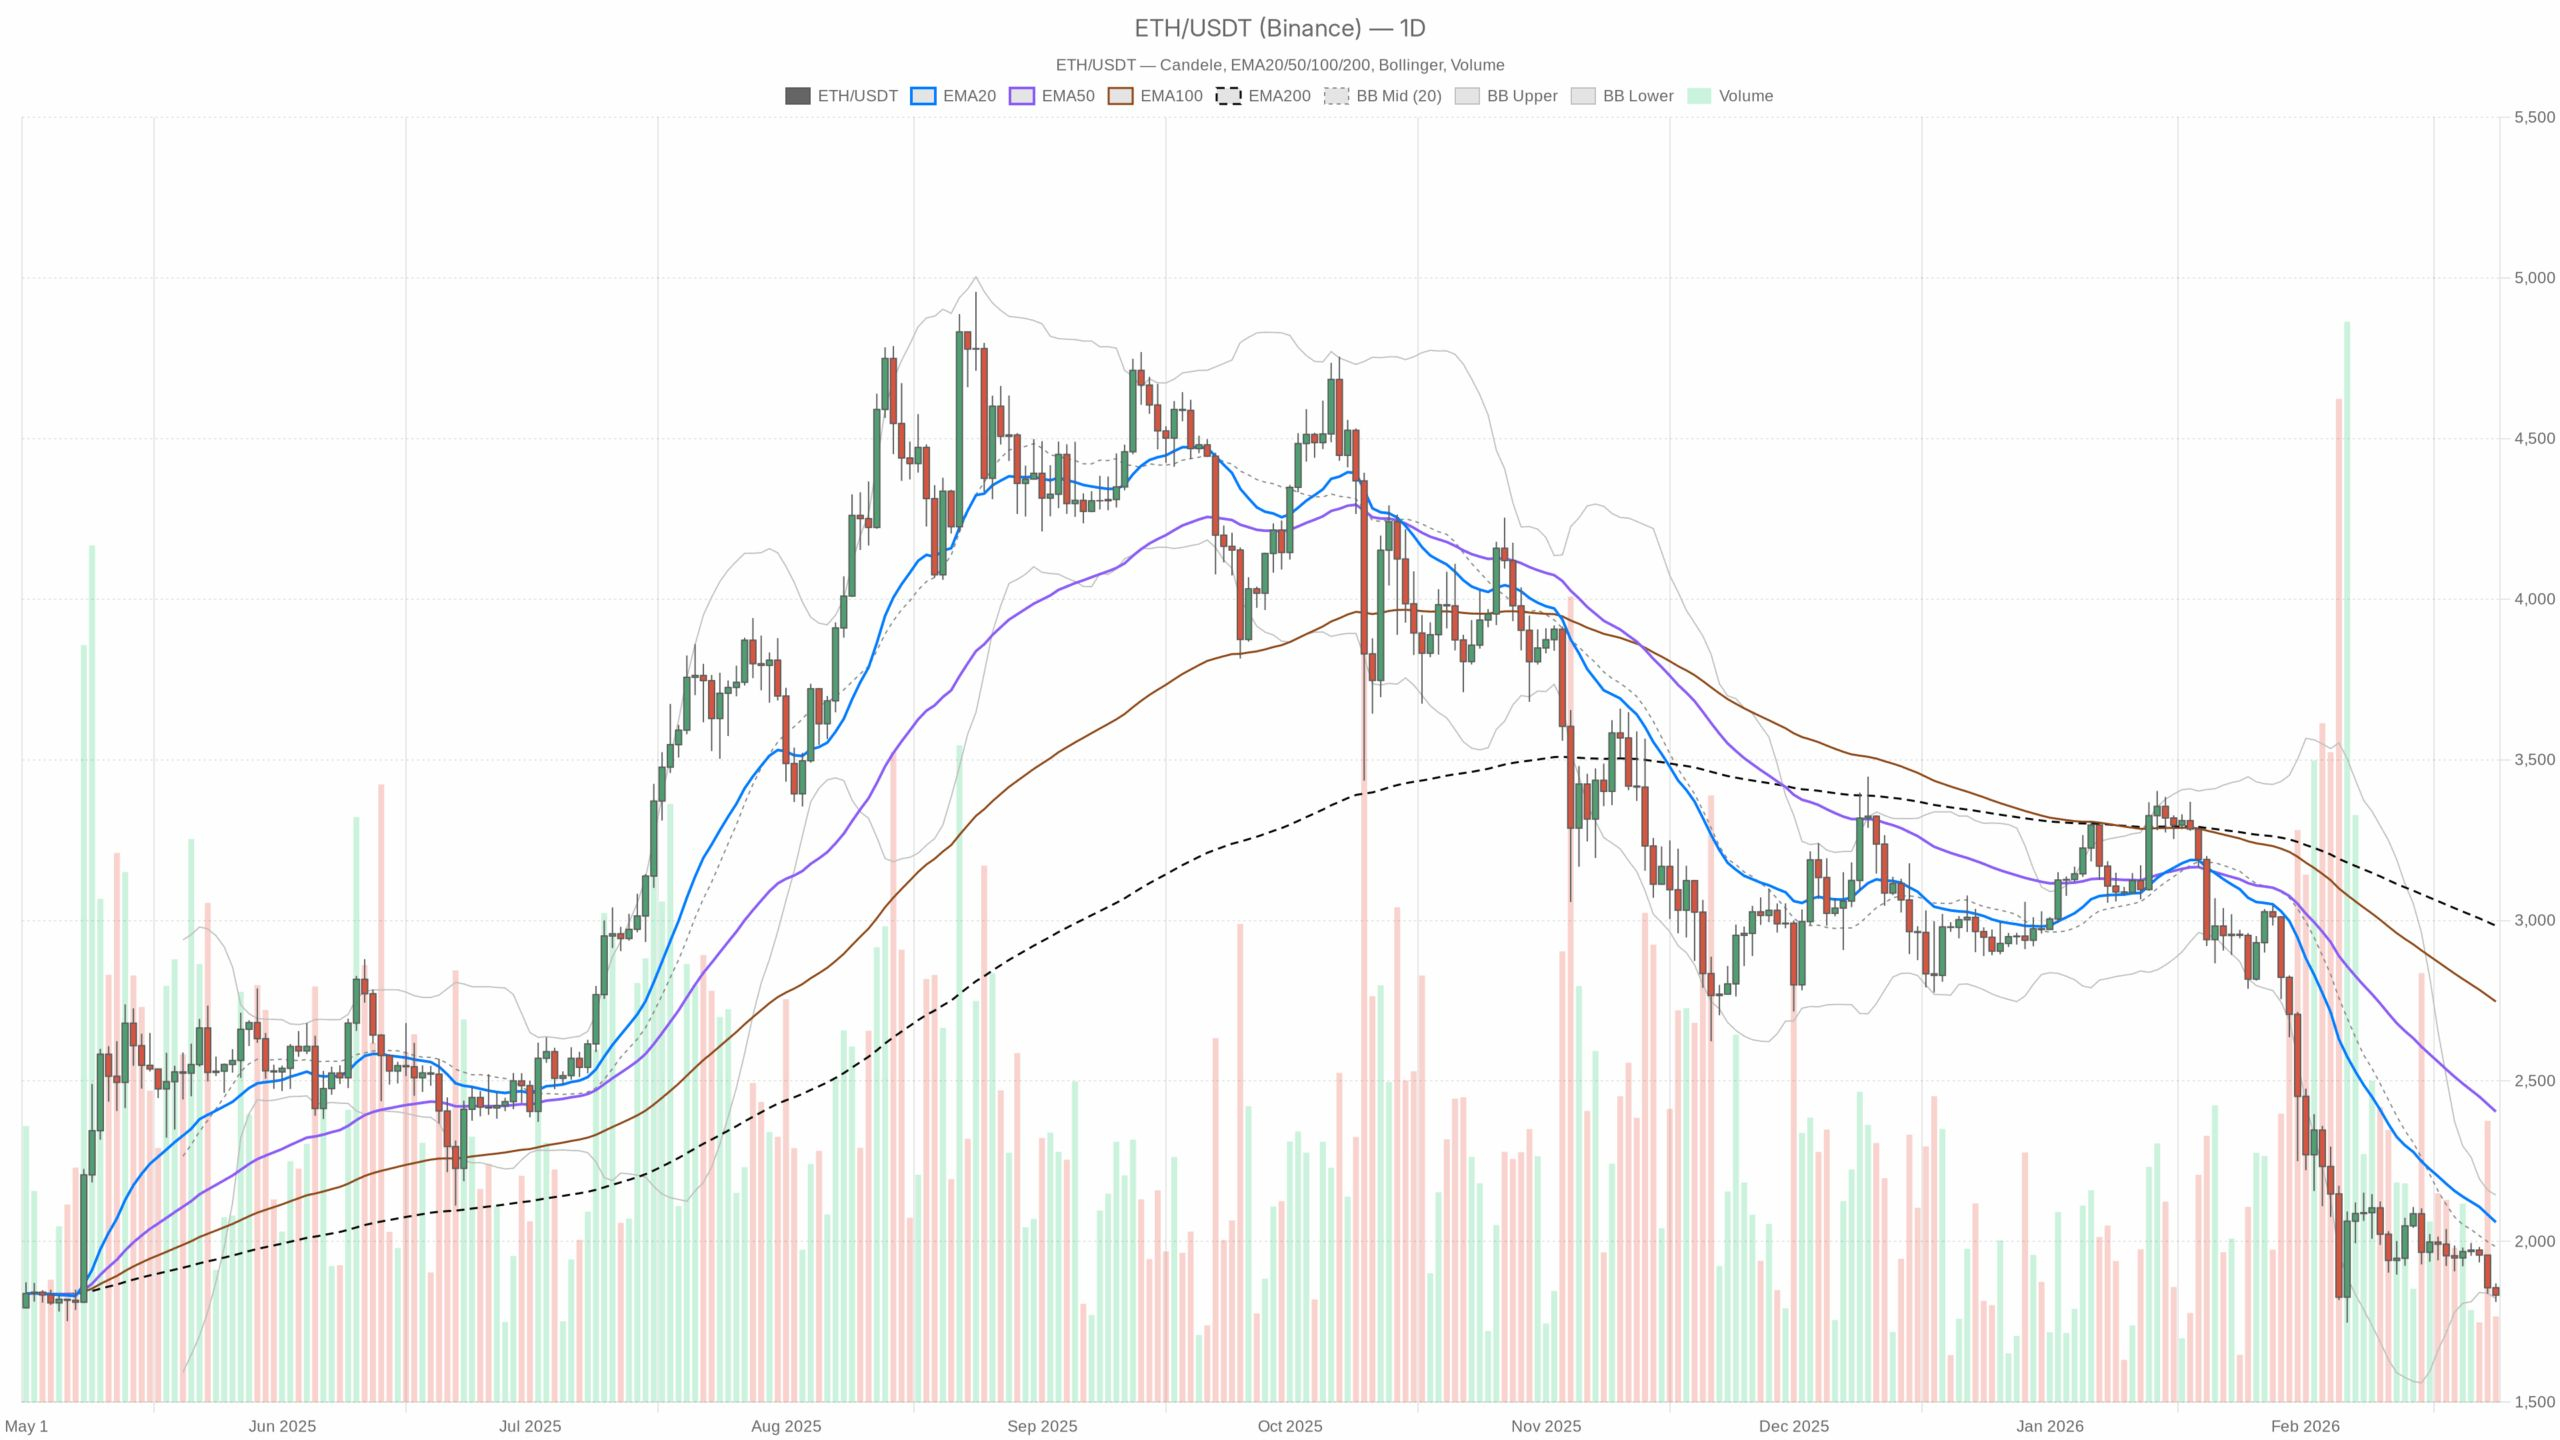
Overview of core data across multiple time frames
Time range, direction, probability, take profit price, stop loss price
5m-1h, neutral, 22.51%,2031.27,2031.27
4h-6h, neutral, 29.22%, 2034.00, 2034.00
12h-48h, down, 76.78%, 1826.63, 2125.24
Key indicator interpretation:
RSI dropped to 29.2 (oversold but continuously weak)
MACD_hist -7.3945 (bear market momentum is very strong)
VPIN 0.65 + imbalance -0.54 (selling pressure dominates)
Funding rate -0.0649 (bulls under pressure)
Volatility has expanded to 0.2224
Entry reference price: around 2048.98
Suggested position: 0.23 (small position test) or directly hold cash and observe
No resonance high-level trend summary:
Short, medium, and long-term probabilities are severely inconsistent → no clear resonance!
Final operation suggestion: Mainly hold cash and observe, or test with a very small position, strict stop-loss is key!
Avoid chasing highs and selling lows, protecting principal is the hard truth.
What do you think? Will ETH first rebound to test 2034 or drop directly to 1826?
Welcome to discuss opinions in the comments! Like + share + follow, I will continue to bring deeper quantitative analysis in the next issue!