ETH noon trading volume decreased rebound, can the 2060 support hold?
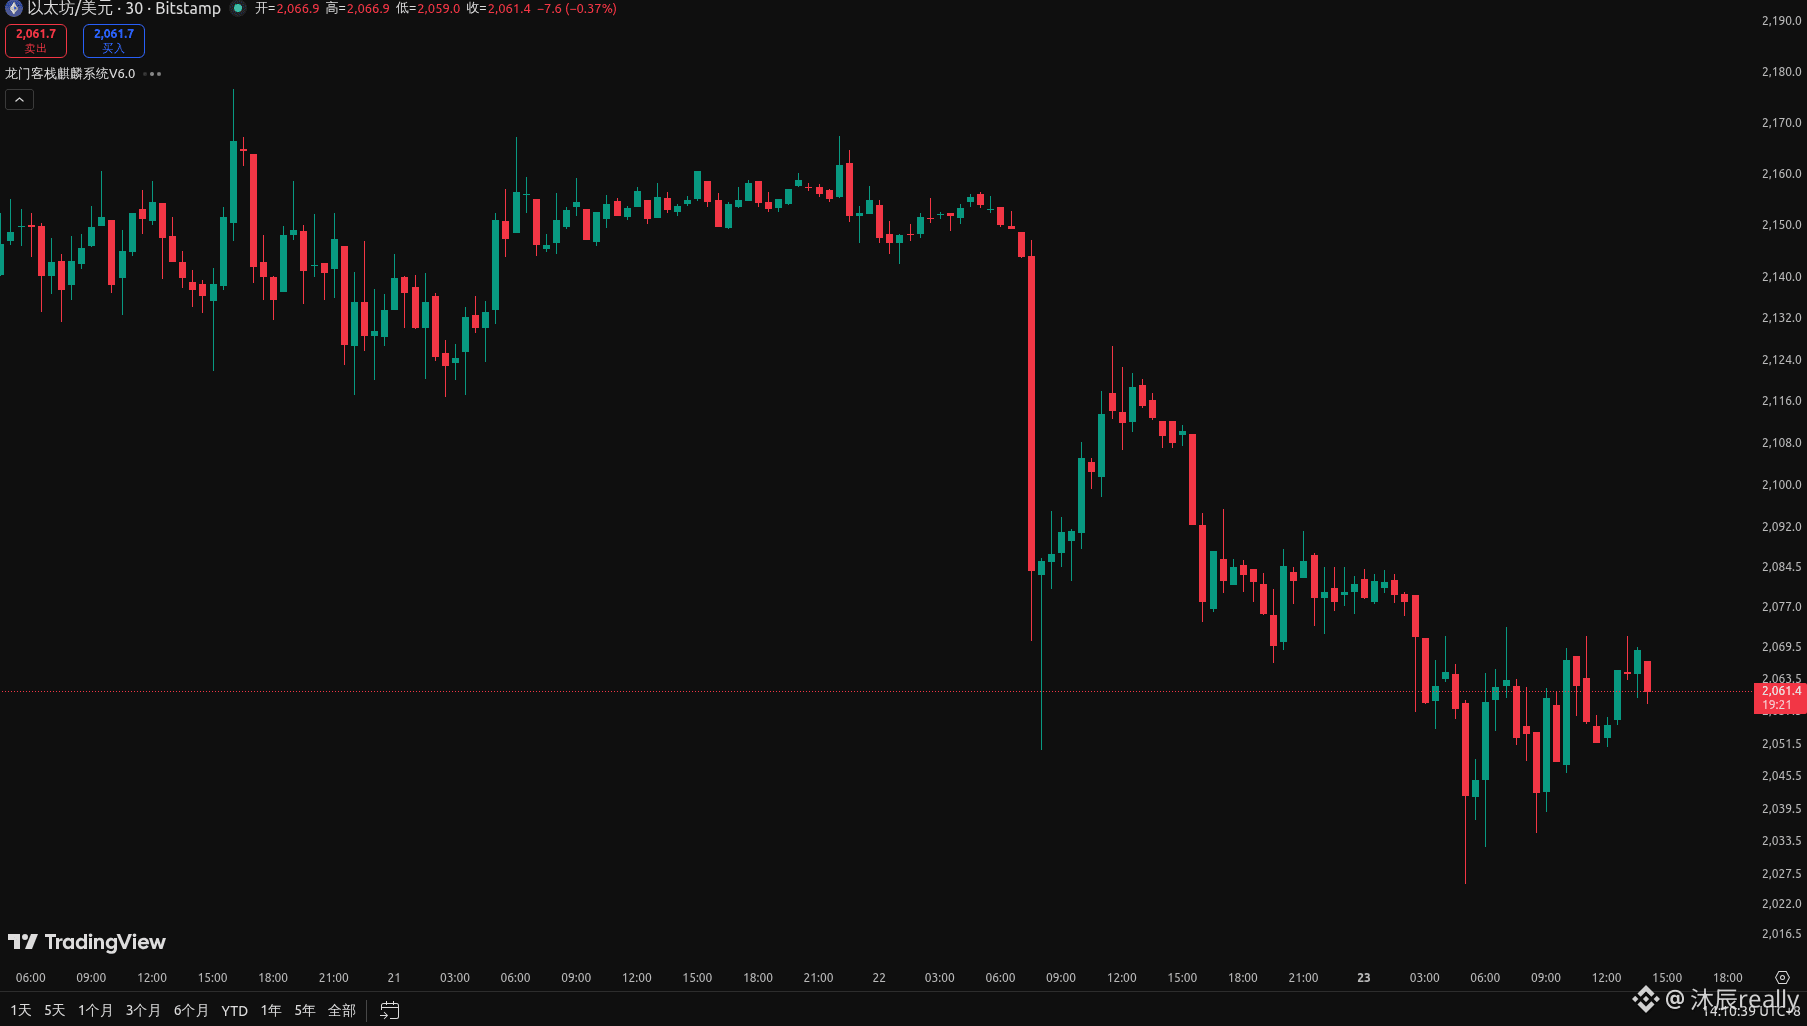
Market overview: ETH/USDT is currently at 2061.89, down 2.32% in the last 24 hours, but the 4-hour level still maintains an upward structure. The latest 4-hour candlestick closed up, rebounding from a low of 2026.0 during the day, with a maximum reaching 2072.11, showing a volatile recovery trend.
Technical analysis: According to the chart visual reading, there are no traditional moving averages or cloud layers for reference, nor any clear signal markings. The core observation point is in trading volume — the lower subgraph shows that the volume bars have recently turned green and significantly shrunk, indicating that the current rebound lacks sufficient buying follow-up, and caution is advised for insufficient momentum. The red horizontal dashed line in the chart forms a key dynamic support, with prices reacting multiple times in this area.
#tradingview #麒麟指标 #合约 #ETH #BTC
Key price levels: The upper resistance to focus on is the daily high of 2113.34 and the 4H line high of 2072.11; the lower core support first looks at the red dashed line area (around the 2050-2060 range), followed by the recent low of 2026.0.
Operation strategy: Although the 4-hour trend is upward, the decreased volume rebound hides risks. Aggressive traders can lightly try to go long when the price pulls back to the red dashed line support area (2050-2060) and a stop-loss candlestick appears, with stop-loss set below 2026; for conservative traders, it is recommended to wait for the price to break above 2072 or 2113 with increased volume to confirm the direction before following up. It is not advisable to chase the rise at the current stage, strict position management is required, and priority should be given to protecting the principal.
This article represents personal views only and does not constitute any investment advice. DYOR.
Market overview: ETH/USDT is currently at 2061.89, down 2.32% in the last 24 hours, but the 4-hour level still maintains an upward structure. The latest 4-hour candlestick closed up, rebounding from a low of 2026.0 during the day, with a maximum reaching 2072.11, showing a volatile recovery trend.
Technical analysis: According to the chart visual reading, there are no traditional moving averages or cloud layers for reference, nor any clear signal markings. The core observation point is in trading volume — the lower subgraph shows that the volume bars have recently turned green and significantly shrunk, indicating that the current rebound lacks sufficient buying follow-up, and caution is advised for insufficient momentum. The red horizontal dashed line in the chart forms a key dynamic support, with prices reacting multiple times in this area.
#tradingview #麒麟指标 #合约 #ETH #BTC
Key price levels: The upper resistance to focus on is the daily high of 2113.34 and the 4H line high of 2072.11; the lower core support first looks at the red dashed line area (around the 2050-2060 range), followed by the recent low of 2026.0.
Operation strategy: Although the 4-hour trend is upward, the decreased volume rebound hides risks. Aggressive traders can lightly try to go long when the price pulls back to the red dashed line support area (2050-2060) and a stop-loss candlestick appears, with stop-loss set below 2026; for conservative traders, it is recommended to wait for the price to break above 2072 or 2113 with increased volume to confirm the direction before following up. It is not advisable to chase the rise at the current stage, strict position management is required, and priority should be given to protecting the principal.
This article represents personal views only and does not constitute any investment advice. DYOR.