


Bitcoin is not just a cryptocurrency, but is also likened to 'Digital Gold' and has become a key index of the global asset market. With a limited supply of 21 million coins and decentralized security, Bitcoin has been recognized as a powerful store of value in the era of inflation.
Recently, although the fluctuations seem more stable after the approval of ETF funds, Bitcoin still shows sudden price changes based on macroeconomic indicators and Futures market movements. In particular, the price zone of 68,000 USDT is an important boundary, where a fierce battle between buyers and sellers is taking place. Let’s analyze the chart below in detail to capture Bitcoin's short-term direction.
Current price and General trend
Current price: 68,355.7 USDT (Down -2.77% compared to yesterday).
Trend analysis: The chart is showing a downtrend channel pattern with subsequent peaks lower than the previous peaks. After a recent sharp decline, the price is trying to make a slight recovery after confirming support around the 68,000 USDT area. However, the price remains below the short-term moving averages (MA), indicating that downward pressure is still very high.
Analysis of Moving Averages (MA) and Indicators
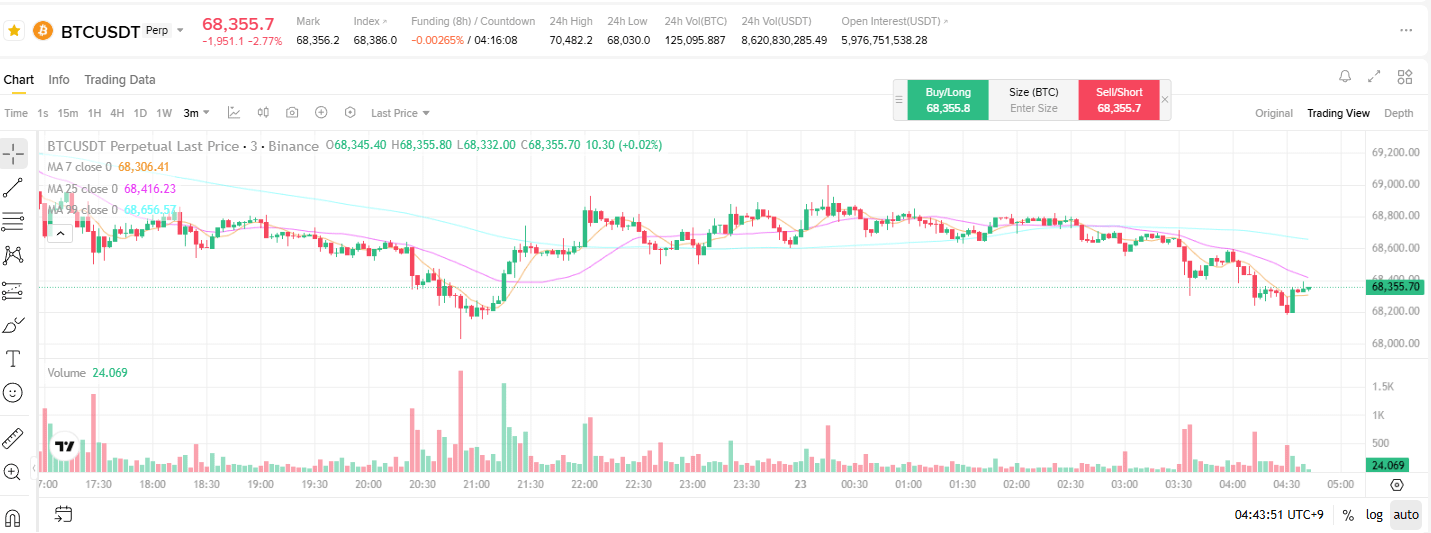
MA(7) - Yellow: At 68,306.41, almost close to the current price. This is the decisive area for the short-term direction.
MA(25) - Purple: At 68,416.23, acting as a resistance level just above the current price.
MA(99) - Sky blue: At 68,656.57, serving as a long-term resistance level. If this line is not broken, the likelihood of a continuing downtrend is high.
Analysis of Trading Volume
Looking at the trading volume below the chart, it can be seen that the red columns (selling pressure) surged at the time of price decline. This indicates that sellers are controlling the market. If this recovery is not accompanied by an increase in trading volume, it risks being just a technical rebound (Bull trap).
Future prospects and Important price zones
Support zone: The 68,000 USDT area is an important psychological and technical support level. If this level is broken, the price may drop deep below 67,500 USDT.
Resistance zone: Breaking through the level of 68,420 USDT (MA 25) is the first important step. To confirm a clear trend reversal, the price needs to hold above the level of 68,660 USDT (MA 99).
Disclaimer
This analysis is based on chart data and is purely a personal opinion, not investment advice or a recommendation to buy or sell. Cryptocurrency investment is highly volatile, and investors must take responsibility for their own decisions. Please note that significant losses may occur depending on market conditions.