



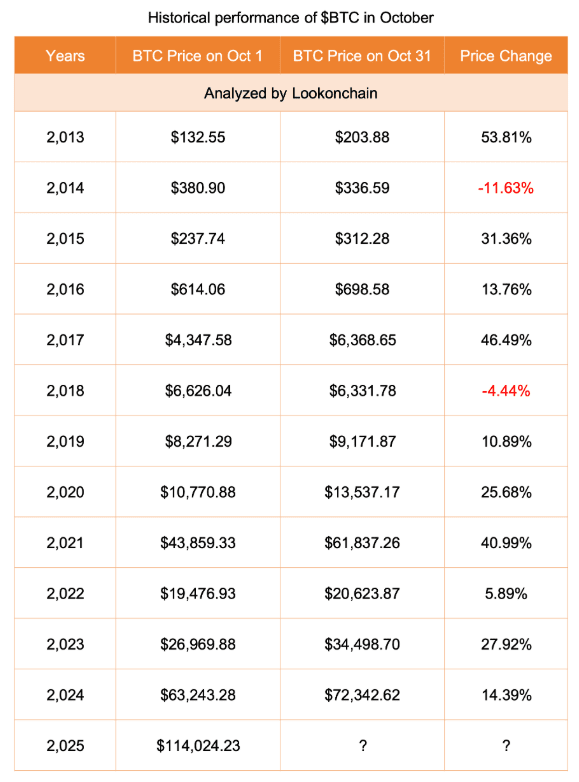
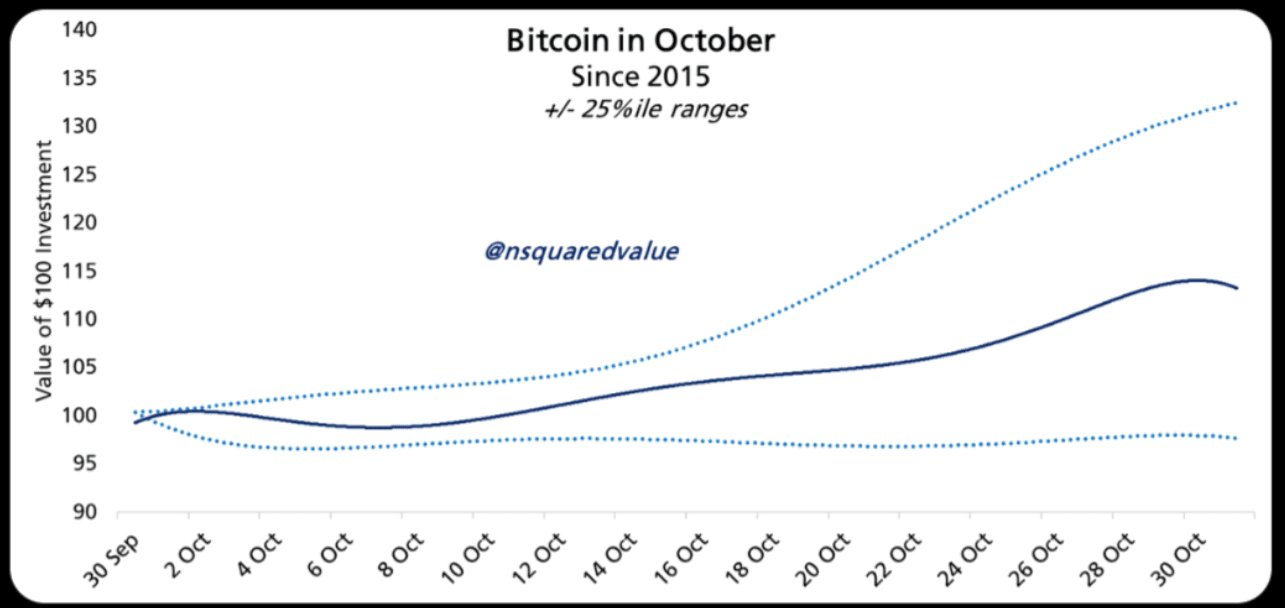
Bitcoin (BTC) wrapped up September with a 5.35% increase, despite the correction in the last days of the month. On-chain data from Lookonchain shows that whenever September ends in the green, the market often witnesses a 'Pumptober' – a strong breakout phase in October.
Right in the first trading session of the new month, Bitcoin has continued to rise. The question arises: will history repeat itself once again, opening the door for a booming growth cycle?
The 'double bottom' pattern aims for a target of 127,000 USD.
On the daily chart, Bitcoin is gradually completing the 'double bottom' pattern – a classic bullish reversal pattern, which usually forms when the price bounces twice from the same support area before breaking upwards.
With BTC, both bottoms appeared around the 113,000 USD mark, while the neckline is at the 117,300 USD area.
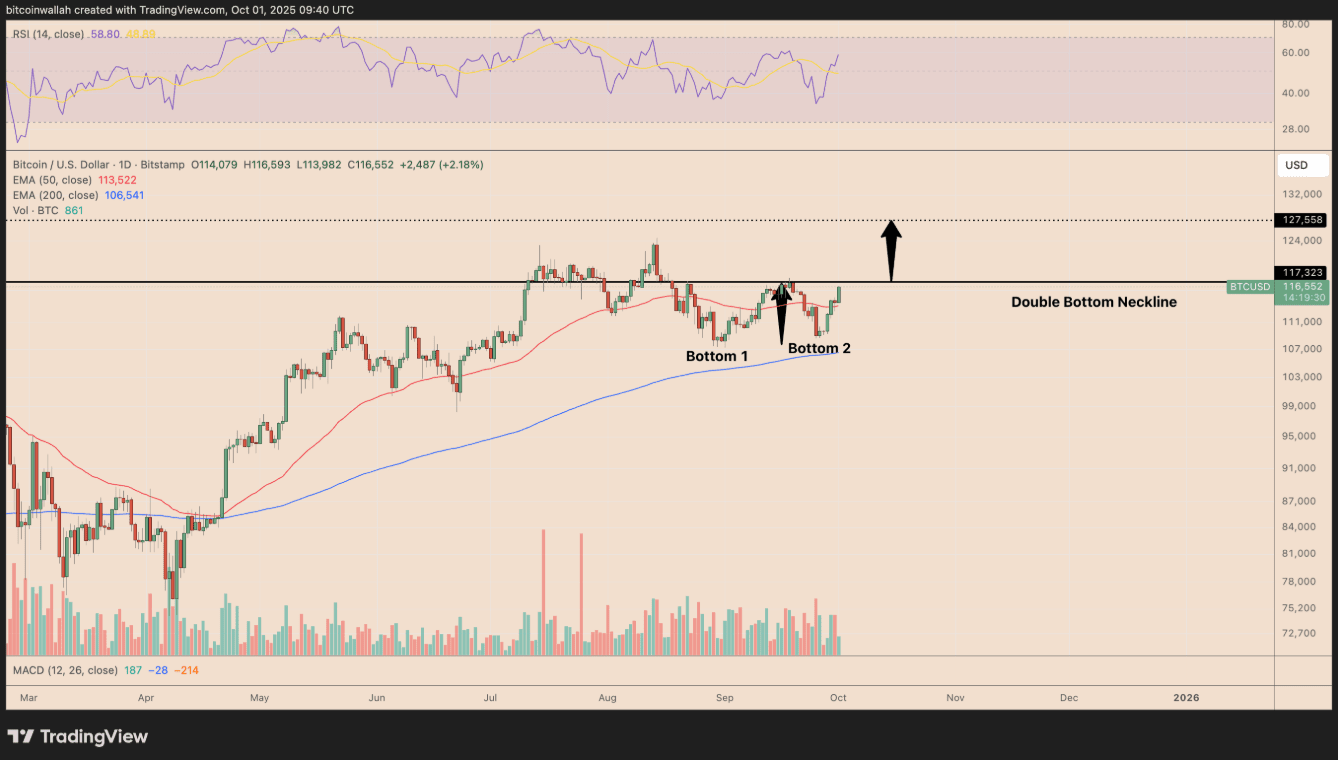
If the bulls can create a decisive breakout above this neckline, the technical target suggests Bitcoin could aim for around 127,500 USD. This forecast is calculated by measuring the height of the pattern and adding it to the breakout point.
At the same time, the Relative Strength Index (RSI) has also bounced back from the neutral zone, indicating that buying pressure is prevailing.
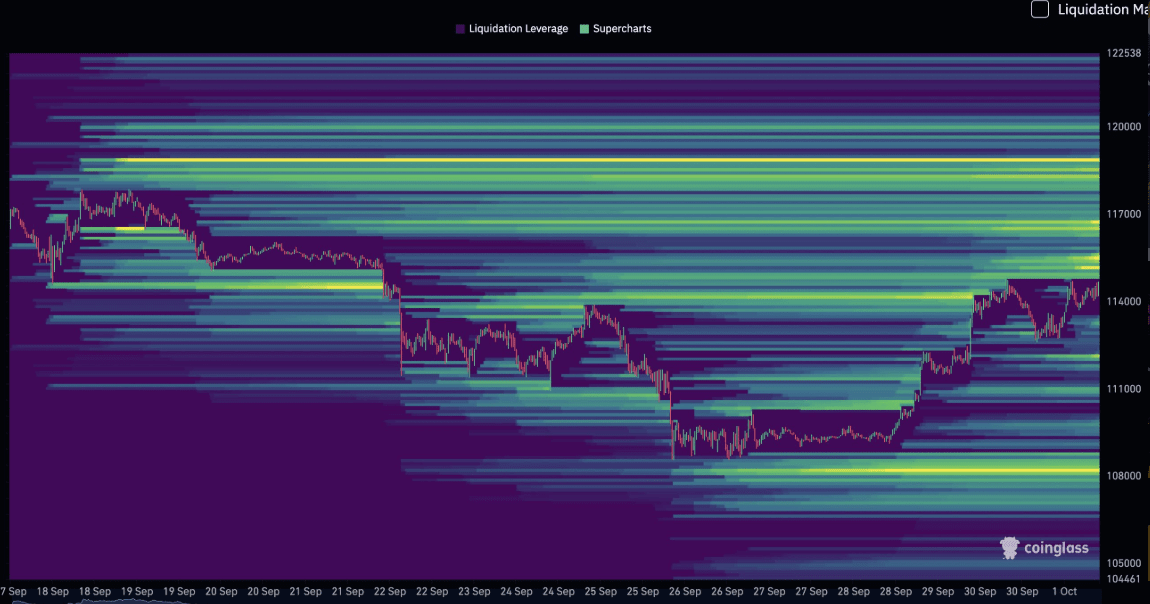
Notably, if the price exceeds the 118,000–119,000 USD range – where nearly 8 billion USD in Short orders are at risk of being 'liquidated en masse' – the breakout momentum will be further reinforced, expanding the room for BTC to reach the target of the double bottom pattern.
The symmetrical triangle opens up the scenario of 137,000 USD.
In line with the current volatility, Bitcoin is moving within a large symmetrical triangle pattern on the daily chart.
This pattern is formed by a downward trend line connecting the gradually lower peaks and an upward trend line connecting the gradually higher bottoms – usually a signal that precedes a strong breakout when the price approaches the peak of the triangle.
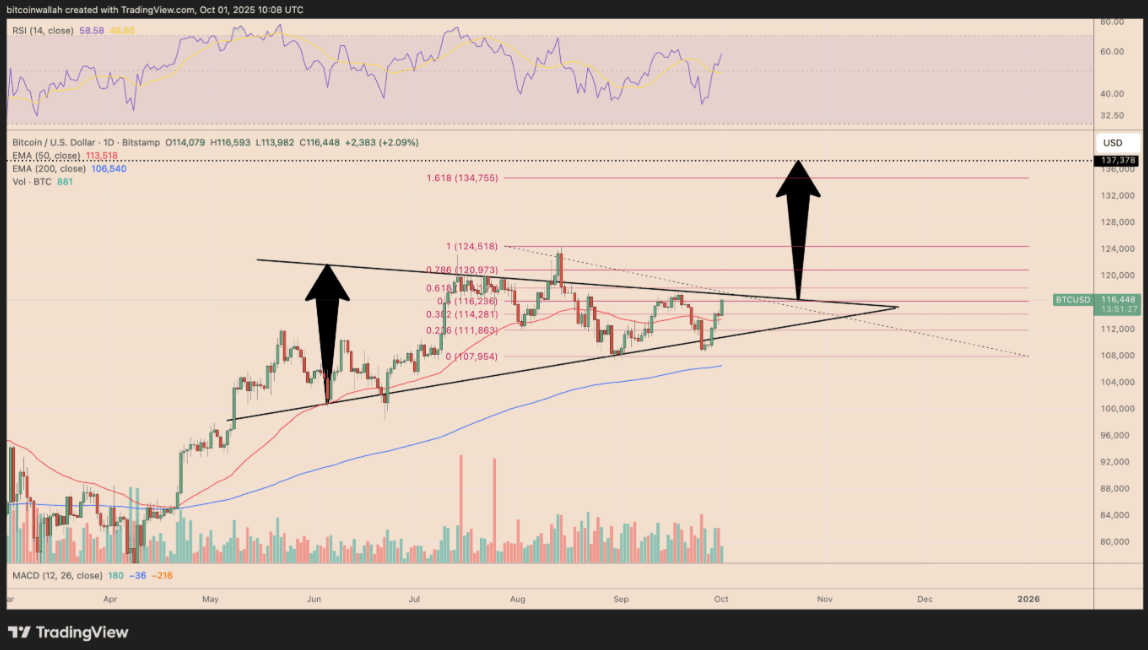
Based on the height of the triangle, the potential target is estimated around 137,000 USD, equivalent to an increase of over 18% from the current price. Notably, this level is almost in line with the Fibonacci extension level of 1.618 at the 134,700 USD area, further reinforcing the reliability of the bullish scenario.
On-chain data shows that BTC has not yet reached its peak.
According to on-chain data, Bitcoin is still trading below the 'heated' risk level, indicating there is still room for price increase before short-term investors enter an overloaded state.
According to Glassnode's 'Short-Term Holder Cost Basis' model, the most recent average purchase price for the group of short-term investors is around 102,900 USD.
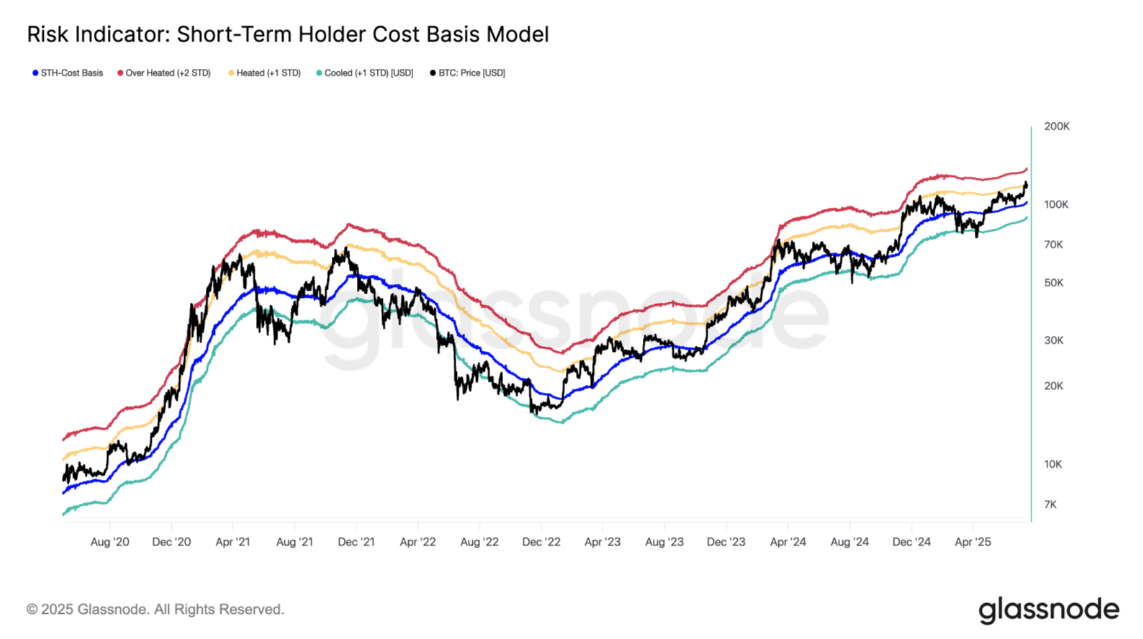
From there, the first risk zone (heated zone) is identified at 122,000 USD, while the overheated zone is at 138,000 USD – a level often associated with cycle peaks in the past.
In other words, if the 'Pumptober' scenario truly explodes, the 122,000 USD mark will be an important short-term challenge, while 138,000 USD is likely to become a significant 'wall' before the market enters a new corrective phase.