



Bitcoin (BTC) is currently fluctuating around the threshold of 109,444 USD, down more than 12.75% from the record high of over 124,500 USD. This adjustment has divided the market into two opposing viewpoints: one side believes that this is just a familiar setback in the upward trend, while the other warns of signs indicating the beginning of a new bear cycle. So, which scenario is more credible?
The model from 2021 suggests the risk of Bitcoin dropping to 60,000 USD
Many analyses suggest that Bitcoin is following a familiar trajectory, reminiscent of the model that signaled the cycle peak in 2021.
According to analyst Reflection, in 2021, BTC surged to a historical peak before forming a 'blow-off top'. Subsequently, the price quickly adjusted to the mid-term support area and failed in its attempt to surpass resistance, paving the way for a decline of over 50% from nearly 69,000 USD to around 32,000 USD in just a few weeks.
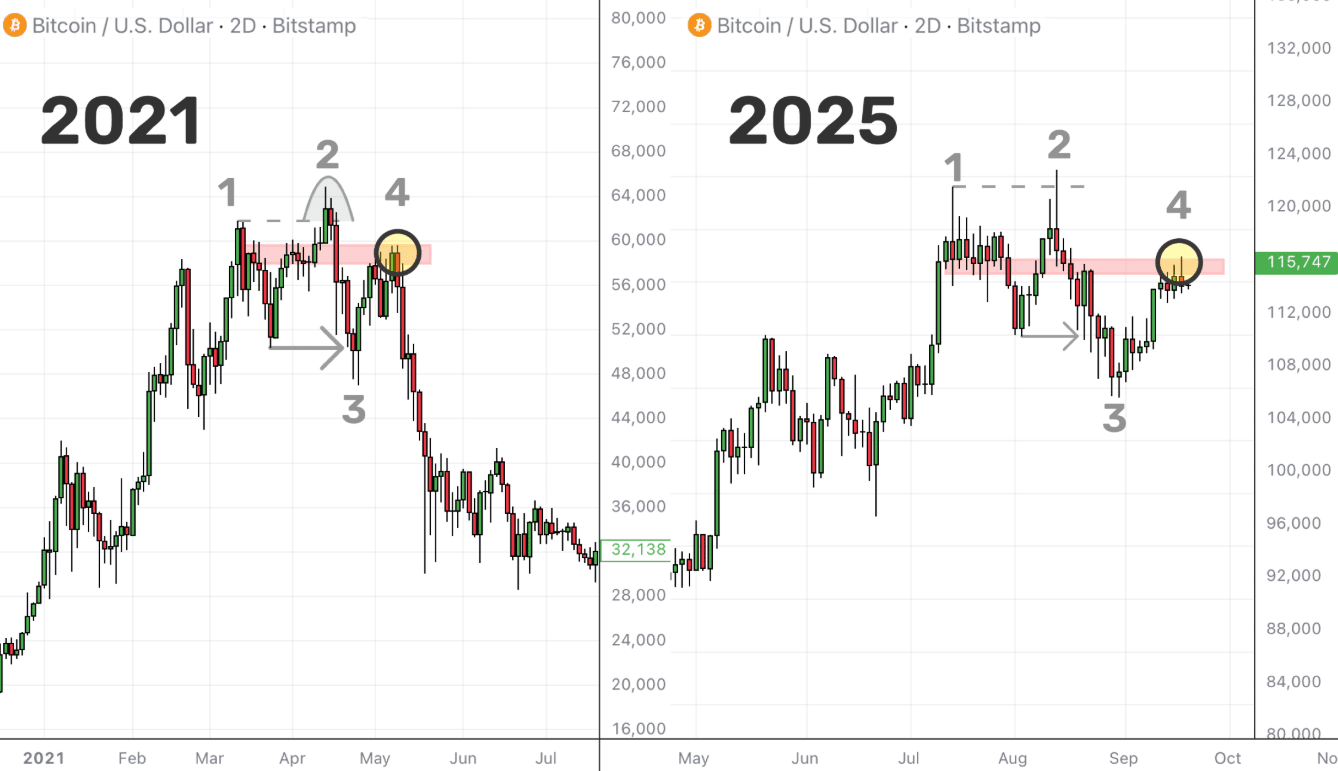
Currently, the price structure for 2025 is repeating four similar steps, with Bitcoin oscillating just below the distribution zone – which previously marked the start of a strong downtrend four years ago. If this scenario repeats, BTC could face the risk of rejection at the current price level.
On the weekly chart, Bitcoin has also just broken the 'rising wedge' pattern – a technical signal that often indicates a bearish reversal, formed from a series of higher highs and higher lows within a narrow range.
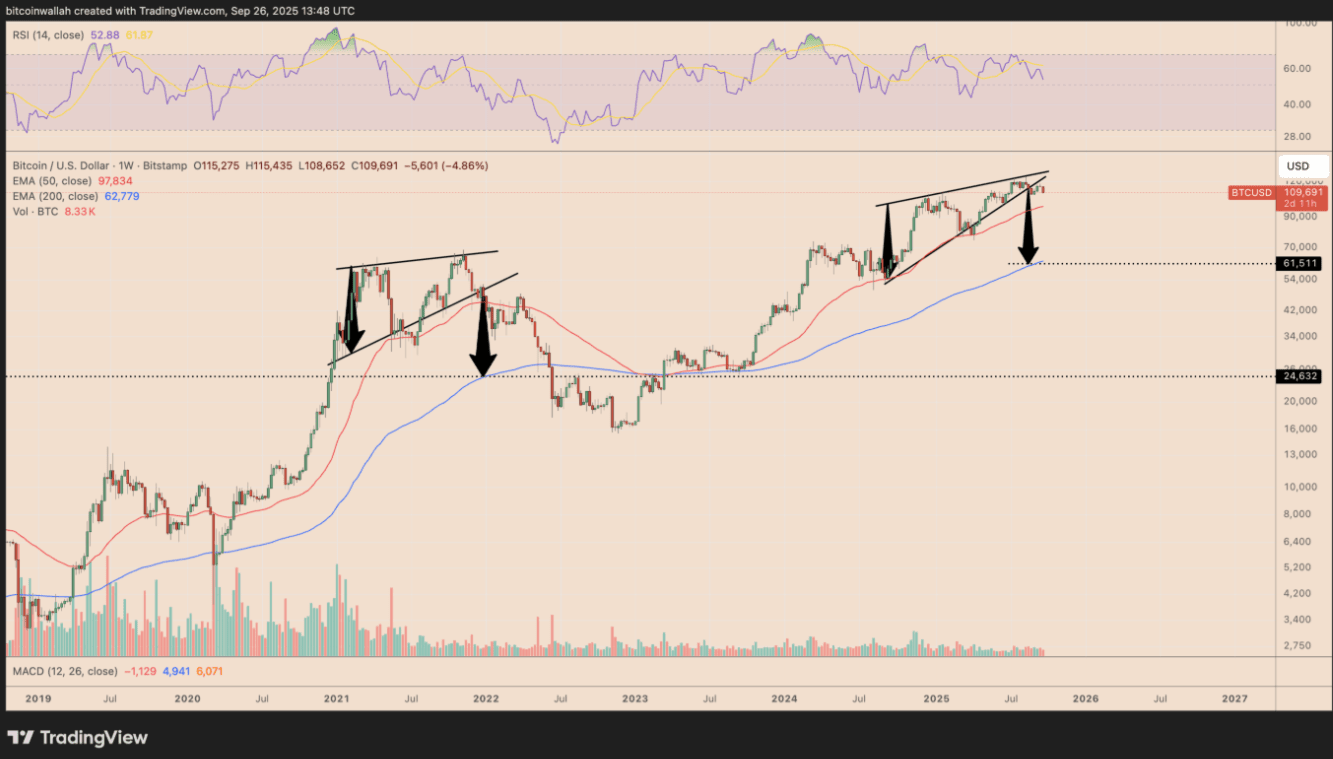
This breakdown increases the likelihood of the price sliding down to the 60,000 – 62,000 USD range, coinciding with the 200-week exponential moving average (EMA, the blue line). Some experts even do not rule out the scenario of BTC falling deeper, towards the 50,000 USD threshold.
Notably, in 2021, the breakout of the rising wedge pattern also caused Bitcoin to lose up to 55% of its value, hitting precisely the 200-week EMA before finding balance again.
The recovery scenario exceeds 124,500 USD
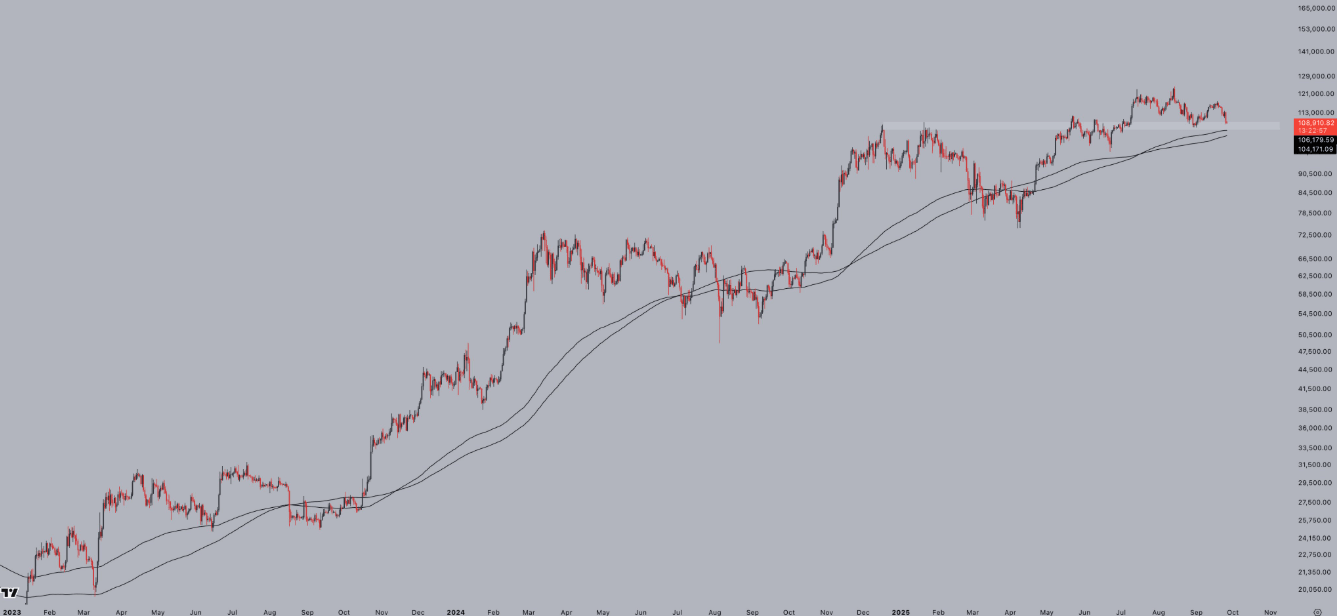
Trader Jesse emphasizes the key support cluster formed by the 200-day simple moving average (SMA) and exponential moving average (EMA) – which often serves as a 'buffer' during corrections in a bullish market. According to him, this could be the area that helps BTC establish a 'mid-term bottom'. As of Friday, this EMA support area is in the range of 104,000 – 106,000 USD.
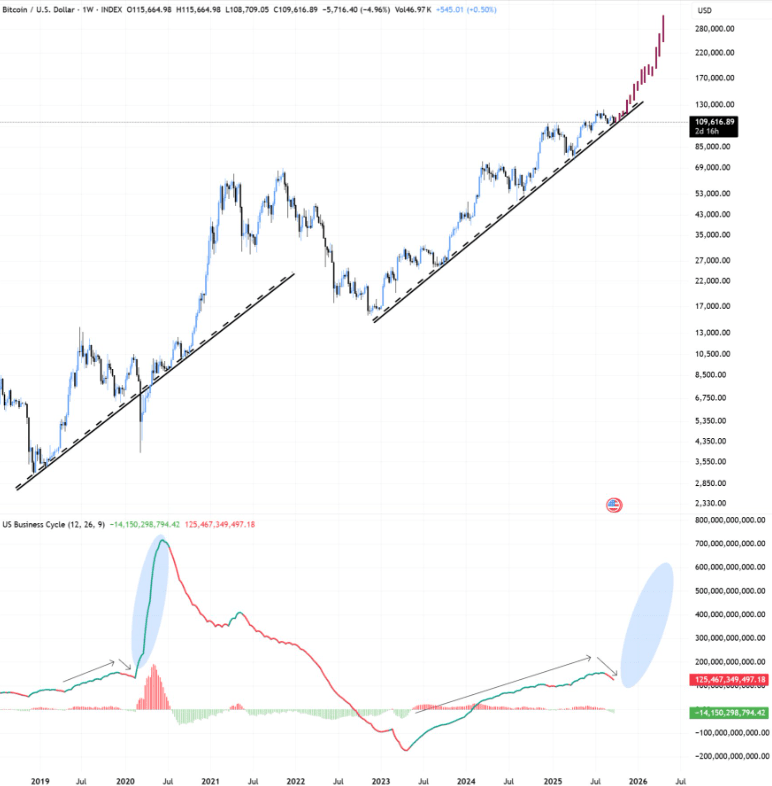
Bitbull's perspective also reinforces confidence in the bullish trend, suggesting that Bitcoin is still quite far from a true cycle peak. He cites the US Business Cycle Index – a broad measure of economic growth – which has not yet peaked, while typically this index leads the financial markets.
With the Federal Reserve (Fed) having entered a rate-cutting cycle, Bitbull forecasts that the cryptocurrency market still has room for growth in the next 3 – 4 months, before moving towards the 'blow-off top' phase.
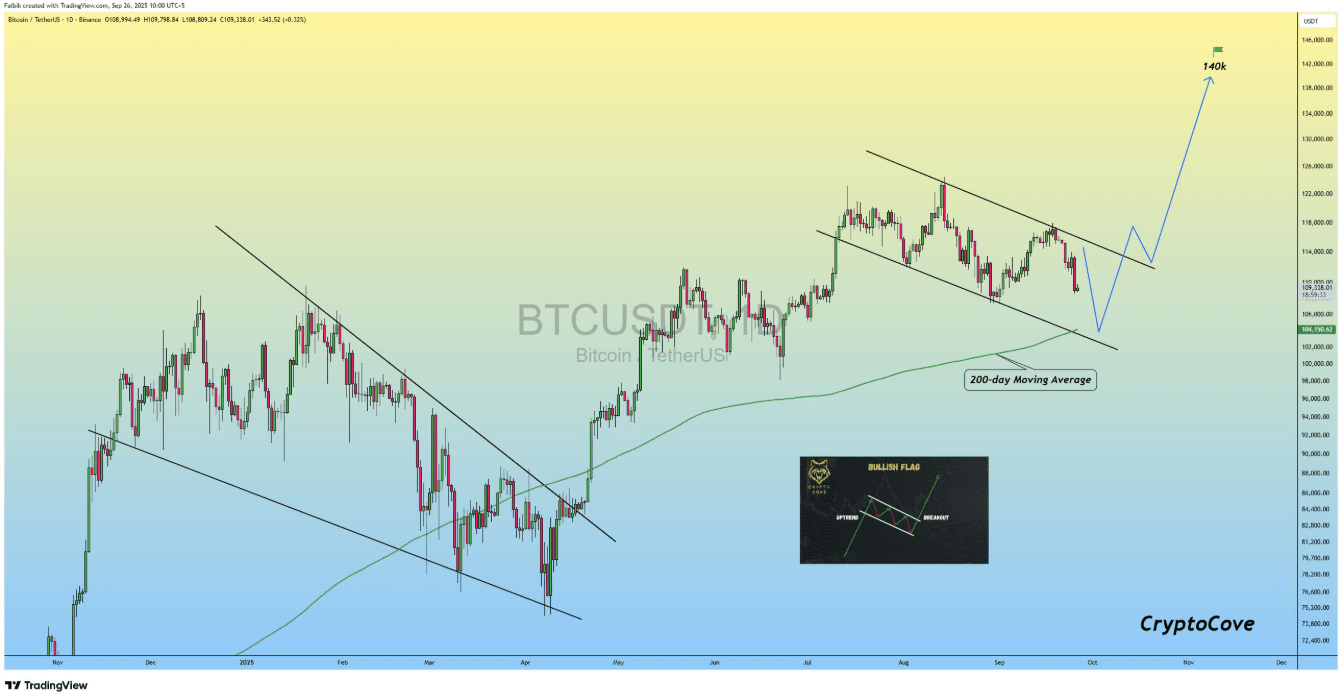
Meanwhile, analyst Captain Faibik believes that the current decline is merely a 'healthy correction', as Bitcoin is testing the 200-day moving average around 104,000 USD as a potential support zone.
He also notes the formation of the 'bull flag' pattern – a technical signal that often precedes a breakout. If BTC decisively breaks the resistance level of 113,000 USD, new upward momentum could open opportunities towards 140,000 USD in the coming months.
Not a few other analysts have also offered similar forecasts for the end-of-year target, with some even more optimistic, expecting Bitcoin to potentially establish a macro peak in the 150,000 – 200,000 USD range.