Crypto Circle Scholar: On 3.17, Ethereum missed 1736, don't miss 2280 again! A pullback is a golden opportunity! Latest market analysis and thought reference
Ethereum's current price is 2330. Are you still hesitating about whether to wait for a pullback before entering? Don't deceive yourself; this wave rose from 1736 to 2347. I was already calling it a golden opportunity around 2100. Now looking back at those who keep shouting about a top and a crash, what else can they do besides slap their thighs? The trend is clear, and those who lack understanding will always hesitate, while those who keep up with the rhythm have already pocketed their profits. This is the most real survival rule in the crypto circle!
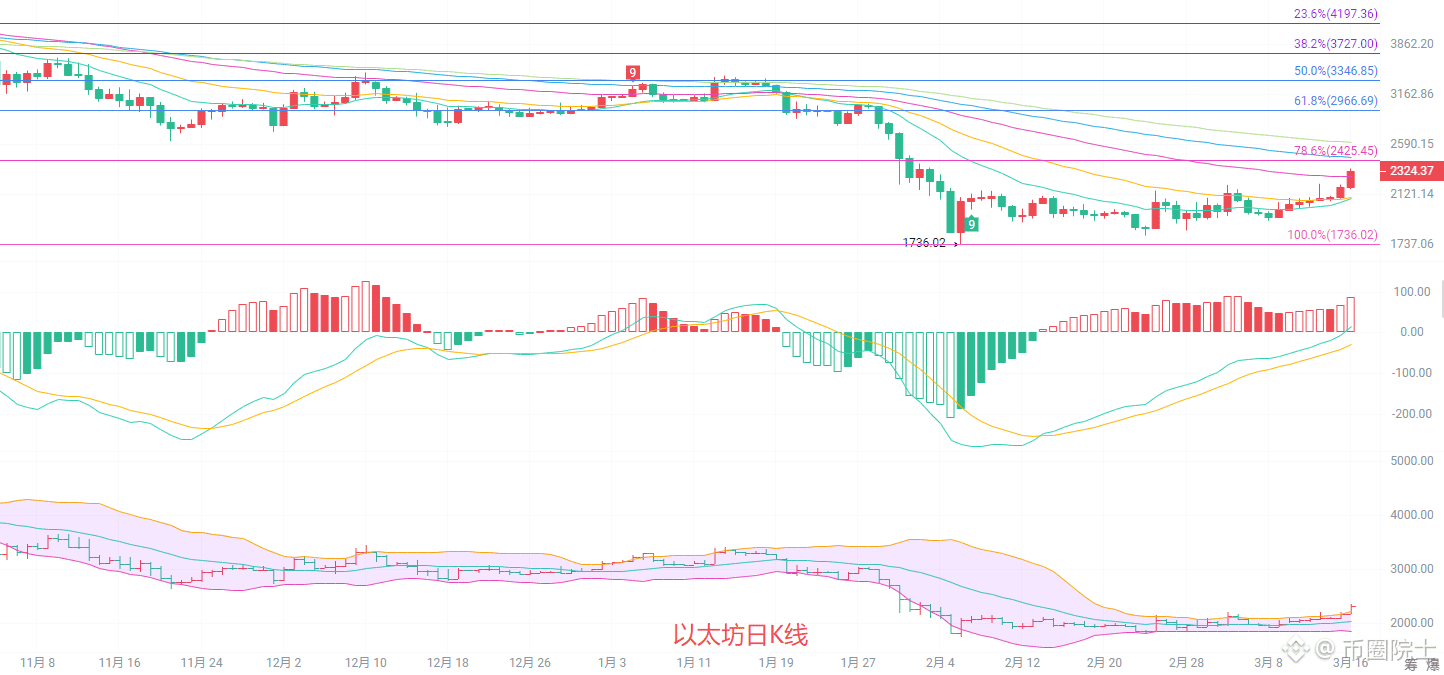
Daily level: Bottom reversal confirmation, 2425 resistance level in sight. After hitting a low of 1736, it rebounded all the way to 2347, and it has now broken through the key resistance at 2200, forming a solid W bottom and upward channel. The bottom structure is stable, which is a typical reversal pattern after a bullish market correction. In terms of indicators, MACD is expanding upward, DIF and DEA are attacking the 0 axis. Once it breaks through the 0 axis, upward momentum will explode completely; the middle track of the Bollinger Bands is turning upward, key signals are showing several consecutive days of positive closes, stabilizing above the EMA30 trend line, and chip concentration is continuously increasing, with significant signs of whale accumulation.
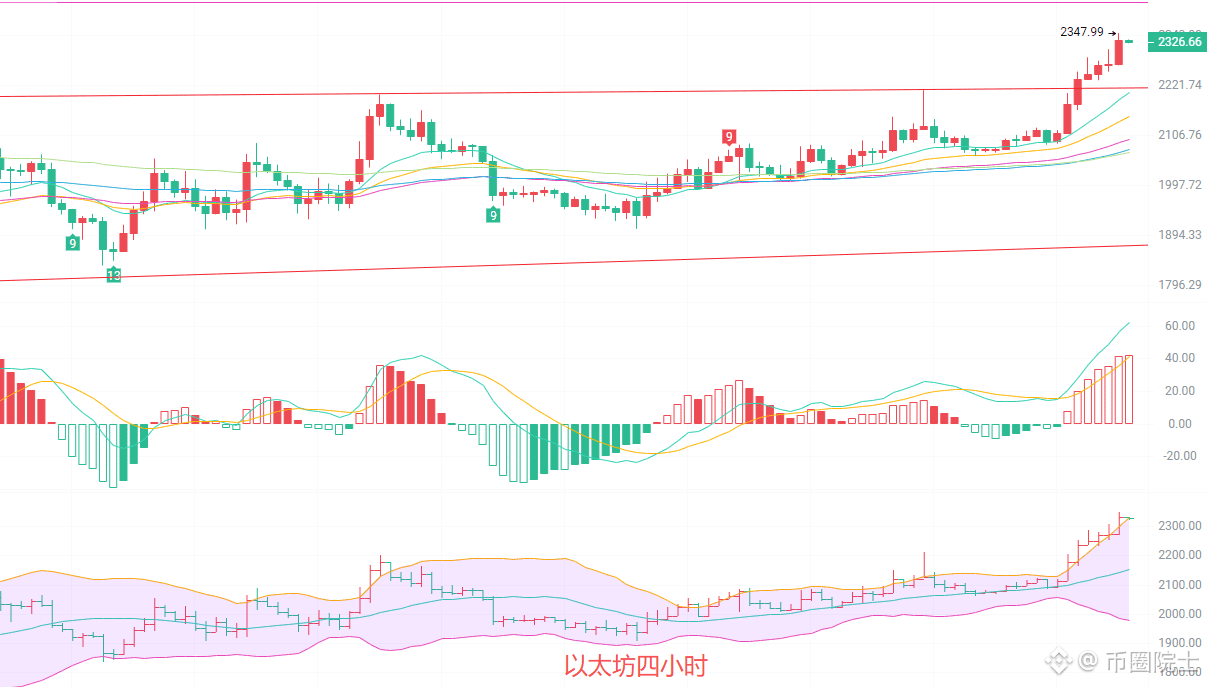
The four-hour pullback has completed its accumulation, and upward movement could explode at any time. After pulling back from 2200, it has been grinding the bottom repeatedly in the 2100 to 2200 range for several days. It has now stabilized at the middle track of the Bollinger Bands and has broken through the upper track: the EMA moving average system has formed a perfect bullish arrangement, and the long-term moving averages are flattening and turning. The downward trend has completely ended, and the upward trend is fully taking over the market. MACD volume and indicators are crossing above the 0 axis, with red bars continuing to expand. KDJ still has upward momentum at a high level, indicating that the short-term rise is not a top but the beginning of a main upward wave. The upward trend remains effective, with a focus on support between 2200 and 2100. As long as it doesn't break, it will firmly go upward.
Short-term reference: (The actual data has been updated; please consult the author for details)
Upward from 2200 to 2100, stop loss at 2000, target looking at 2350 to 2400, break point looking at mid-term target 2420.
Downward from 2400 to 2430, stop loss at 2450, target looking at 2350 to 2300, break point looking at 2250.
Specific operations are based on real-time market data. For more information, please consult the author. There may be delays in article publication, and it is recommended for reference only; risks are borne by yourself.
$ETH #ETH合约 #ETH走势分析
Ethereum's current price is 2330. Are you still hesitating about whether to wait for a pullback before entering? Don't deceive yourself; this wave rose from 1736 to 2347. I was already calling it a golden opportunity around 2100. Now looking back at those who keep shouting about a top and a crash, what else can they do besides slap their thighs? The trend is clear, and those who lack understanding will always hesitate, while those who keep up with the rhythm have already pocketed their profits. This is the most real survival rule in the crypto circle!
Daily level: Bottom reversal confirmation, 2425 resistance level in sight. After hitting a low of 1736, it rebounded all the way to 2347, and it has now broken through the key resistance at 2200, forming a solid W bottom and upward channel. The bottom structure is stable, which is a typical reversal pattern after a bullish market correction. In terms of indicators, MACD is expanding upward, DIF and DEA are attacking the 0 axis. Once it breaks through the 0 axis, upward momentum will explode completely; the middle track of the Bollinger Bands is turning upward, key signals are showing several consecutive days of positive closes, stabilizing above the EMA30 trend line, and chip concentration is continuously increasing, with significant signs of whale accumulation.
The four-hour pullback has completed its accumulation, and upward movement could explode at any time. After pulling back from 2200, it has been grinding the bottom repeatedly in the 2100 to 2200 range for several days. It has now stabilized at the middle track of the Bollinger Bands and has broken through the upper track: the EMA moving average system has formed a perfect bullish arrangement, and the long-term moving averages are flattening and turning. The downward trend has completely ended, and the upward trend is fully taking over the market. MACD volume and indicators are crossing above the 0 axis, with red bars continuing to expand. KDJ still has upward momentum at a high level, indicating that the short-term rise is not a top but the beginning of a main upward wave. The upward trend remains effective, with a focus on support between 2200 and 2100. As long as it doesn't break, it will firmly go upward.
Short-term reference: (The actual data has been updated; please consult the author for details)
Upward from 2200 to 2100, stop loss at 2000, target looking at 2350 to 2400, break point looking at mid-term target 2420.
Downward from 2400 to 2430, stop loss at 2450, target looking at 2350 to 2300, break point looking at 2250.
Specific operations are based on real-time market data. For more information, please consult the author. There may be delays in article publication, and it is recommended for reference only; risks are borne by yourself.
$ETH #ETH合约 #ETH走势分析