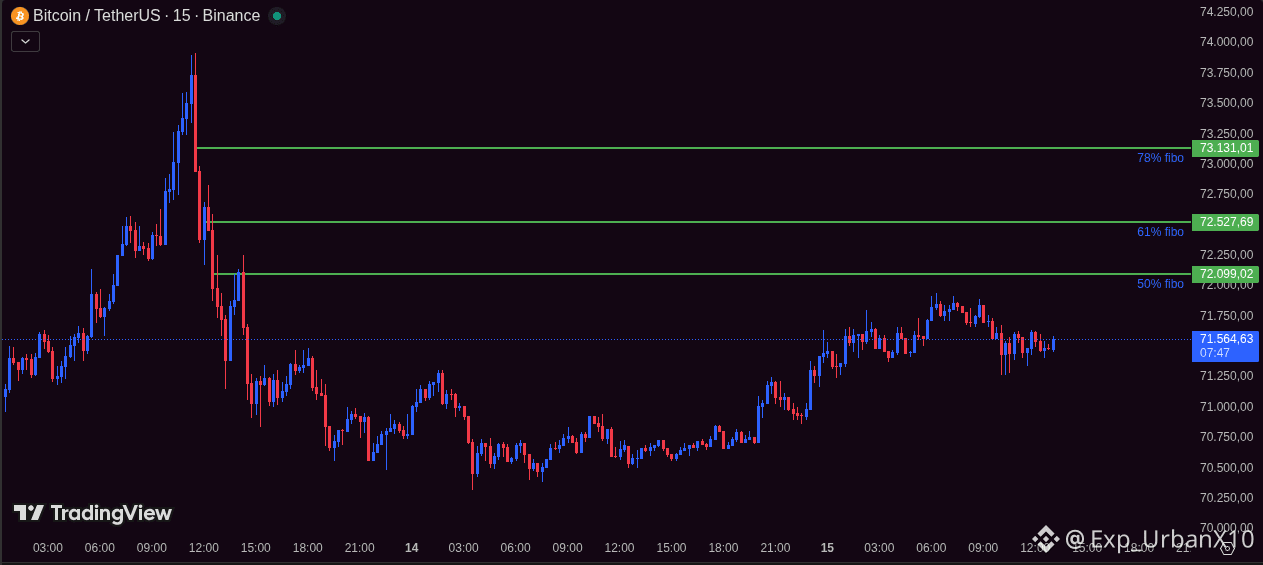
📊 BTCUSDT – Possible continuation of bullish trend?
After the strong correction, the market seems to be accumulating strength below the 50% Fibonacci level.
👀 In the 15-minute chart of Bitcoin, the price is consolidating near 71.5k, forming a structure that may indicate a continuation of the bullish movement.
🔹 Important resistances:
• 72,000 (50% Fibonacci)
• 72,500 (61% Fibonacci)
• 73,100 (78% Fibonacci)
If the price can break the 72k region, we might see a quick movement targeting 72.5k – 73k.
📈 Current structure:
• consolidation after drop
• slightly ascending highs
• possible preparation for breakout
⚠️ Of course, if it loses 71k, the scenario changes and it may seek liquidity further down.
💬 What do you think?
Will BTC break 72k or is there more correction coming?
#Bitcoin #PriceAction $BTC
After the strong correction, the market seems to be accumulating strength below the 50% Fibonacci level.
👀 In the 15-minute chart of Bitcoin, the price is consolidating near 71.5k, forming a structure that may indicate a continuation of the bullish movement.
🔹 Important resistances:
• 72,000 (50% Fibonacci)
• 72,500 (61% Fibonacci)
• 73,100 (78% Fibonacci)
If the price can break the 72k region, we might see a quick movement targeting 72.5k – 73k.
📈 Current structure:
• consolidation after drop
• slightly ascending highs
• possible preparation for breakout
⚠️ Of course, if it loses 71k, the scenario changes and it may seek liquidity further down.
💬 What do you think?
Will BTC break 72k or is there more correction coming?
#Bitcoin #PriceAction $BTC