



RSI (Relative Strength Index)
RSI is an indicator that shows the relative strength between upward and downward pressure on the current price.
Interpretation of Values - Generally, a reading of 70 and above is considered 'Overbought' (price has risen too much), while a reading of 30 and below is considered 'Oversold' (price has fallen too much).
Purpose of Use - It is used to understand how strong the current trend is or when the trend will reverse.
Divergence: Trend Reversal Signal
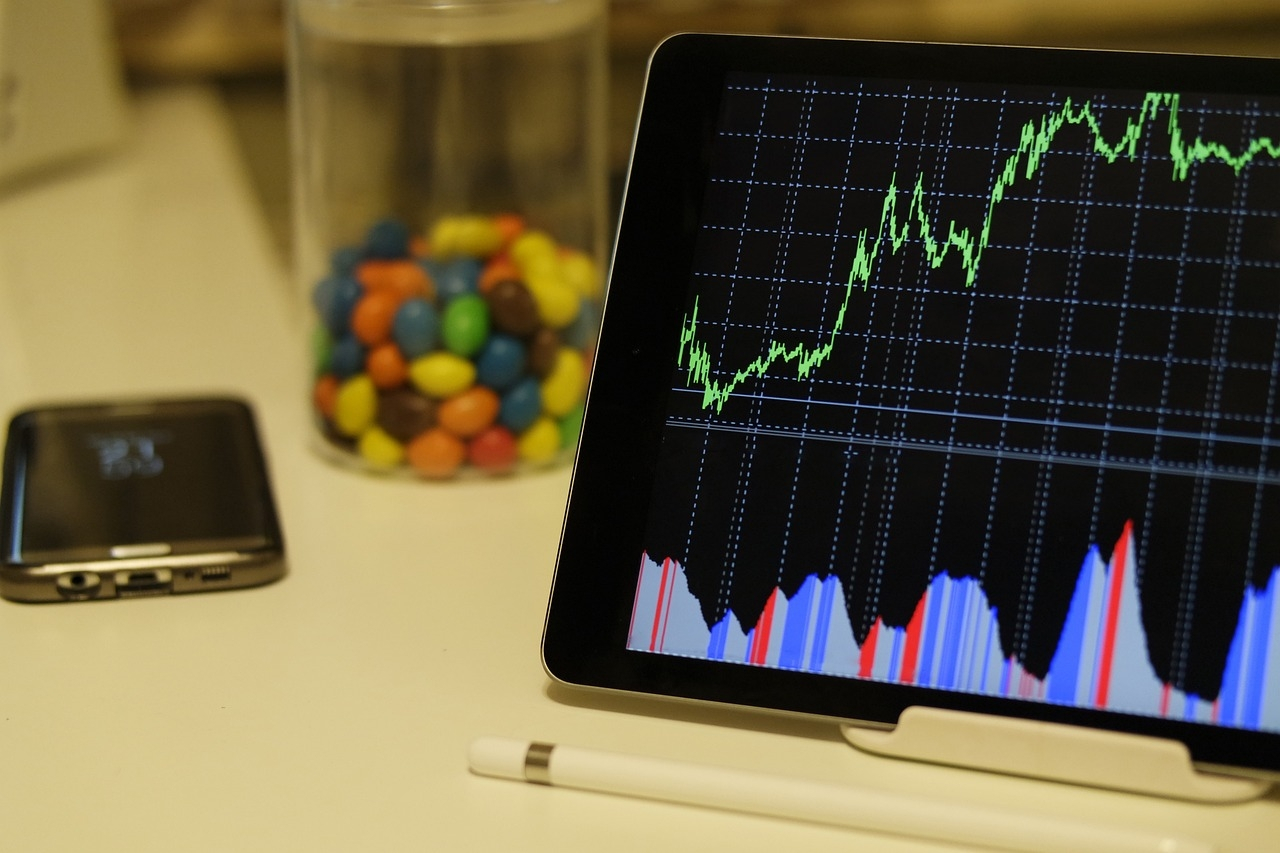
The divergence, known as the flower of auxiliary indicators, occurs when price movements and indicator movements progress in opposite directions. It is read as a strong trend reversal signal.
Negative Divergence
Condition - While the price peaks are rising, the peaks of the RSI are declining.
Meaning - Although the price is rising, it means that the upward strength is weakening. The likelihood of a price drop starting soon is quite high.
Positive Divergence
Condition - While the price bottoms are declining, the bottoms of the RSI are rising.
Meaning - Although the price is falling, it means that the downward strength is weakening. The likelihood of a price increase (reaction buying) starting soon is high.
Bollinger Bands

An indicator based on the principle that the price moves within a certain standard deviation range centered around the moving average.
Structure - It consists of the upper band, the middle line (20-day moving average), and the lower band.
Features - Statistically, more than 95% of the price moves within the bands.
The narrowing of the bands indicates that significant volatility is coming soon.
Touching the upper band can be seen as overheating, while touching the lower band can be seen as excessive cooling; however, when a strong trend begins, the price may continue to move along the band.
Trading Volume

Known as the most honest indicator. It expresses the total amount of the asset traded within a specific period.
Reliability Check - An increase in volume as the price rises indicates that this is a real upward trend. Price increases without volume are likely to be 'false.'
Trend Confirmation - A stop in falling prices and the start of high-volume trades can be interpreted as a signal that a strong buying crowd has entered the market.
Summary Trading Strategy
If the price exceeds its previous peak while the RSI peak remains lower (Negative Divergence), prepare for a sale.
If the price touches the lower Bollinger band while the RSI bottom is rising (Positive Divergence), consider buying.
If all these signals are accompanied by high trading volume, the reliability of the signal increases significantly.