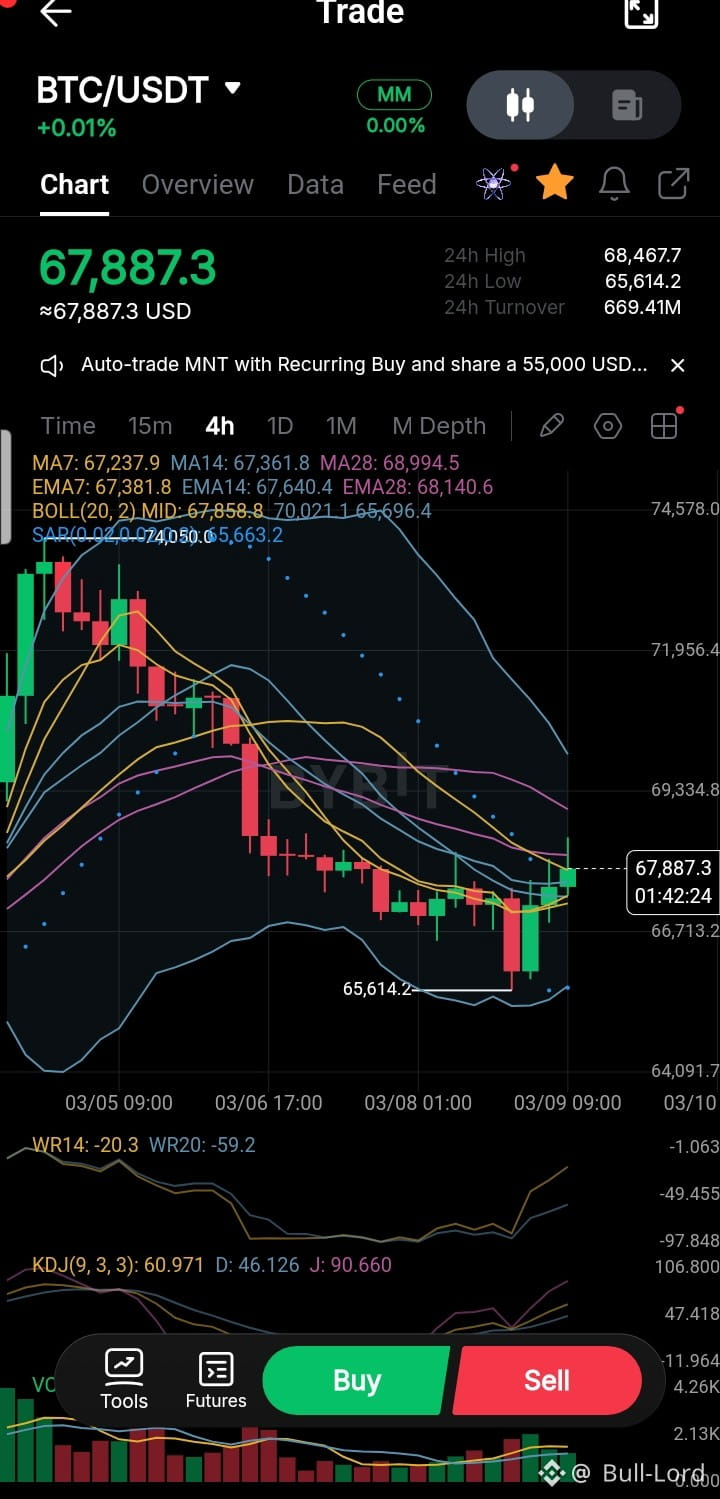
#Iran'sNewSupremeLeader How global events (especially the war involving Donald Trump and Iran) are affecting markets, including Bitcoin.
🌍 1. Global Situation
Conflict in the Middle East is pushing oil prices higher.
Since oil is critical for the global economy, rising prices increase inflation worldwide.
Because of this uncertainty, financial markets (including crypto) are reacting strongly to news headlines, not just technical charts.
📉 2. Bitcoin’s Long-Term Trend (Monthly Chart)
Bitcoin broke its long-term uptrend after falling below $74,400.
The price is already about 50% down from the peak.
In previous cycles:
BTC dropped over 50%
Then broke the monthly trend
After that, it fell another ~40% more.
BTC has printed 5 red monthly candles in a row, which is very bearish.
➡️ However, after so many down months, the author expects a short-term bounce (relief rally).
📊 3. Key Resistance Level (Weekly Chart)
Important level: $69,000 – $71,200.
This area used to reject price before.
Now BTC is below it again and struggling.
➡️ The author says:
Weekly close above $71,200 = confirmation of a relief rally
📅 4. Daily Chart
BTC attempted to break $71,200 but it was a fake breakout.
Fake breakouts recently have led to bigger drops afterward.
Price structure currently shows higher lows, which could support a move up if support holds.
📈 So… Is Bitcoin Going Up or Down?
Short Answer:
Long term: 📉 Bearish (likely downtrend)
Short term: 📈 Possible temporary bounce
Key Level to Watch
Above $71,200 → BTC could rally short-term
Below $71,200 → Market remains weak#Iran'sNewSupremeLeader #StockMarketCrash #IranSuccession $BTC
🌍 1. Global Situation
Conflict in the Middle East is pushing oil prices higher.
Since oil is critical for the global economy, rising prices increase inflation worldwide.
Because of this uncertainty, financial markets (including crypto) are reacting strongly to news headlines, not just technical charts.
📉 2. Bitcoin’s Long-Term Trend (Monthly Chart)
Bitcoin broke its long-term uptrend after falling below $74,400.
The price is already about 50% down from the peak.
In previous cycles:
BTC dropped over 50%
Then broke the monthly trend
After that, it fell another ~40% more.
BTC has printed 5 red monthly candles in a row, which is very bearish.
➡️ However, after so many down months, the author expects a short-term bounce (relief rally).
📊 3. Key Resistance Level (Weekly Chart)
Important level: $69,000 – $71,200.
This area used to reject price before.
Now BTC is below it again and struggling.
➡️ The author says:
Weekly close above $71,200 = confirmation of a relief rally
📅 4. Daily Chart
BTC attempted to break $71,200 but it was a fake breakout.
Fake breakouts recently have led to bigger drops afterward.
Price structure currently shows higher lows, which could support a move up if support holds.
📈 So… Is Bitcoin Going Up or Down?
Short Answer:
Long term: 📉 Bearish (likely downtrend)
Short term: 📈 Possible temporary bounce
Key Level to Watch
Above $71,200 → BTC could rally short-term
Below $71,200 → Market remains weak#Iran'sNewSupremeLeader #StockMarketCrash #IranSuccession $BTC