$ASTER this is burning! 🔥
Look at the key points of the chart:
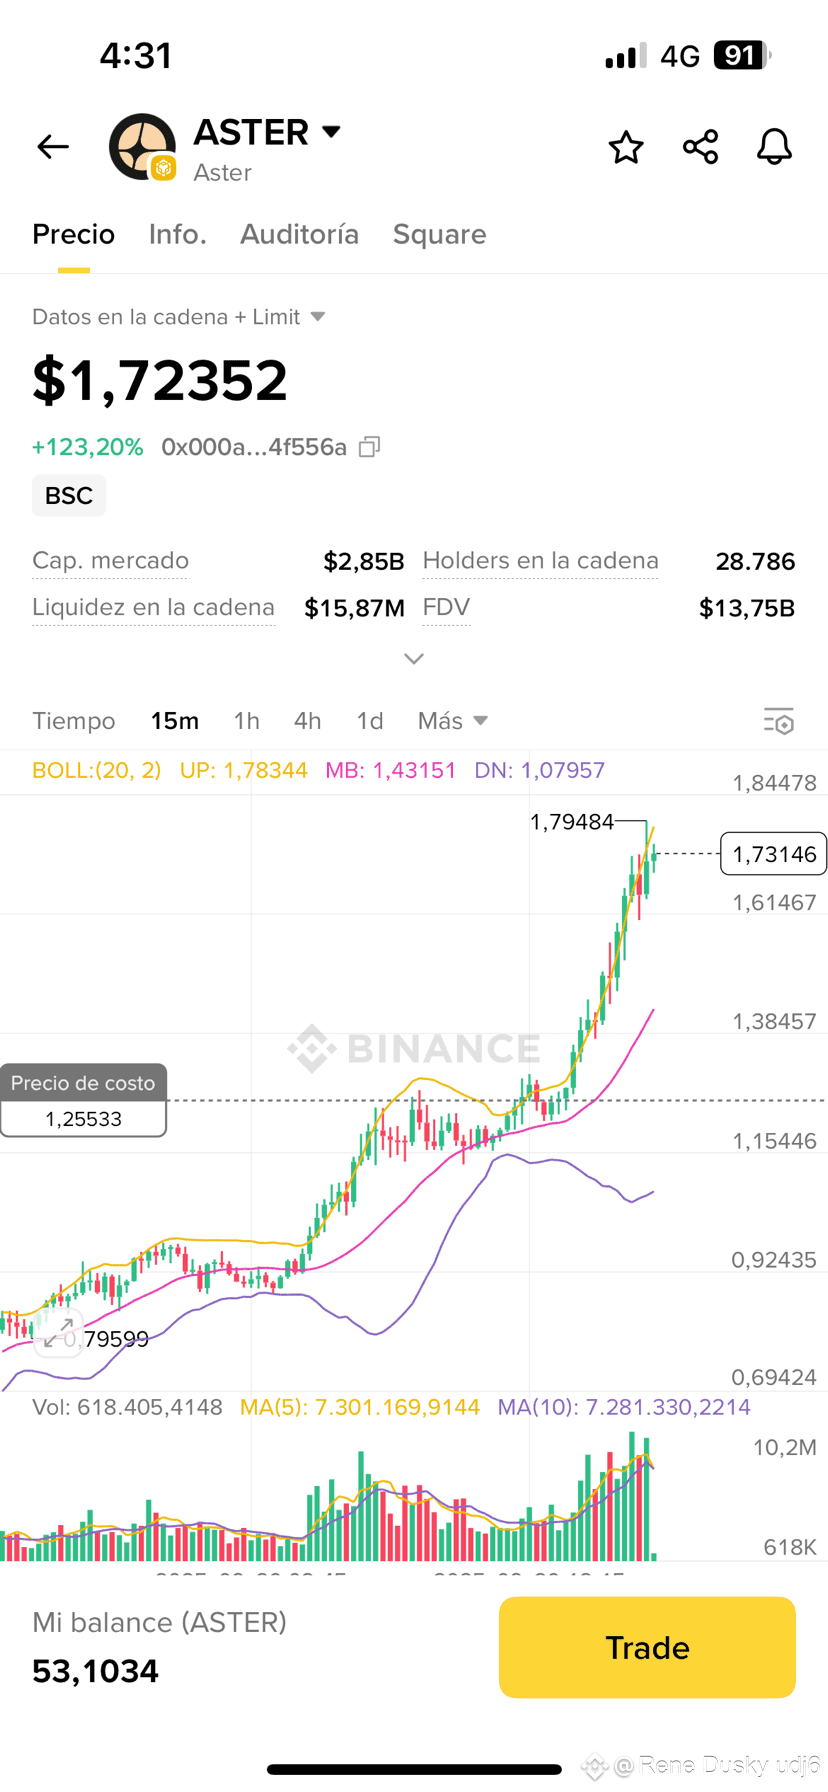
• 📈 Clear trend: The price has been rising steadily, with consecutive green candles, without breaking important supports.
• 📊 Moving averages: The 5 and 10 period averages remain below the price, pointing upwards, confirming buying strength.
• 📍 Bollinger Bands: The price is sticking to the upper band (1.79 max.), which is usually a sign of strong bullish pressure.
• 💰 Volume: It looks high and is accompanying the movement, reinforcing the rise.
• ⚠️ Watch out for resistance: It touched $1.79 and corrected a bit, it could consolidate before looking for $1.85 – $2.00.
It remains bullish, but it is already quite extended. If more volume comes in, it can break and continue, but if it drops below the range of $1.60-$1.65, it would be a sign of correction.
How exciting is this! Do you think it can reach $10?
$ASTER
Look at the key points of the chart:
• 📈 Clear trend: The price has been rising steadily, with consecutive green candles, without breaking important supports.
• 📊 Moving averages: The 5 and 10 period averages remain below the price, pointing upwards, confirming buying strength.
• 📍 Bollinger Bands: The price is sticking to the upper band (1.79 max.), which is usually a sign of strong bullish pressure.
• 💰 Volume: It looks high and is accompanying the movement, reinforcing the rise.
• ⚠️ Watch out for resistance: It touched $1.79 and corrected a bit, it could consolidate before looking for $1.85 – $2.00.
It remains bullish, but it is already quite extended. If more volume comes in, it can break and continue, but if it drops below the range of $1.60-$1.65, it would be a sign of correction.
How exciting is this! Do you think it can reach $10?
$ASTER