
(POWER) – Technical View (POWER/USDT Perpetual)
📉 Current Market Structure
Price: ~0.128
24h Change: +15%
24h High: 0.135
24h Low: 0.108
Key Observation
shows a massive dump from ~2.57 → 0.10 earlier. That means:
The coin had a huge liquidation / unlock / sell-off
Now price is sideways consolidation near the bottom
This is called post-crash accumulation zone.
📊 Indicator Analysis
MACD
Histogram turning green
MACD lines starting bullish crossover
➡️ Indicates short-term bullish momentum building
Volume
Huge sell volume during crash
Now volume decreasing
➡️ Market is cooling down and stabilizing
Price Action
Price is moving sideways between:
Support → 0.105 – 0.11
Resistance → 0.135 – 0.15
📈 Possible Scenarios
🟢 Bullish Scenario
If price breaks 0.135
Next targets:
0.15
0.18
0.22
Short term pump possible 20–70%
🔴 Bearish Scenario
If 0.105 support breaks
Next levels:
0.09
0.07
Another dump possible.
⚠️ Important Warning
Coins that crash 95%+ often become high-risk bounce plays.
This means:
Good for short-term trading
Dangerous for long-term holding
📊 My Trading Plan (Example)
Entry zone:
0.115 – 0.12
Targets:
0.145
0.165
0.19
Stop loss:
0.104
✅ Conclusion:
POWER is in dead-cat bounce / accumulation stage. Short-term pump possible but trend is still weak overall.
👍 If you want, I can also help you 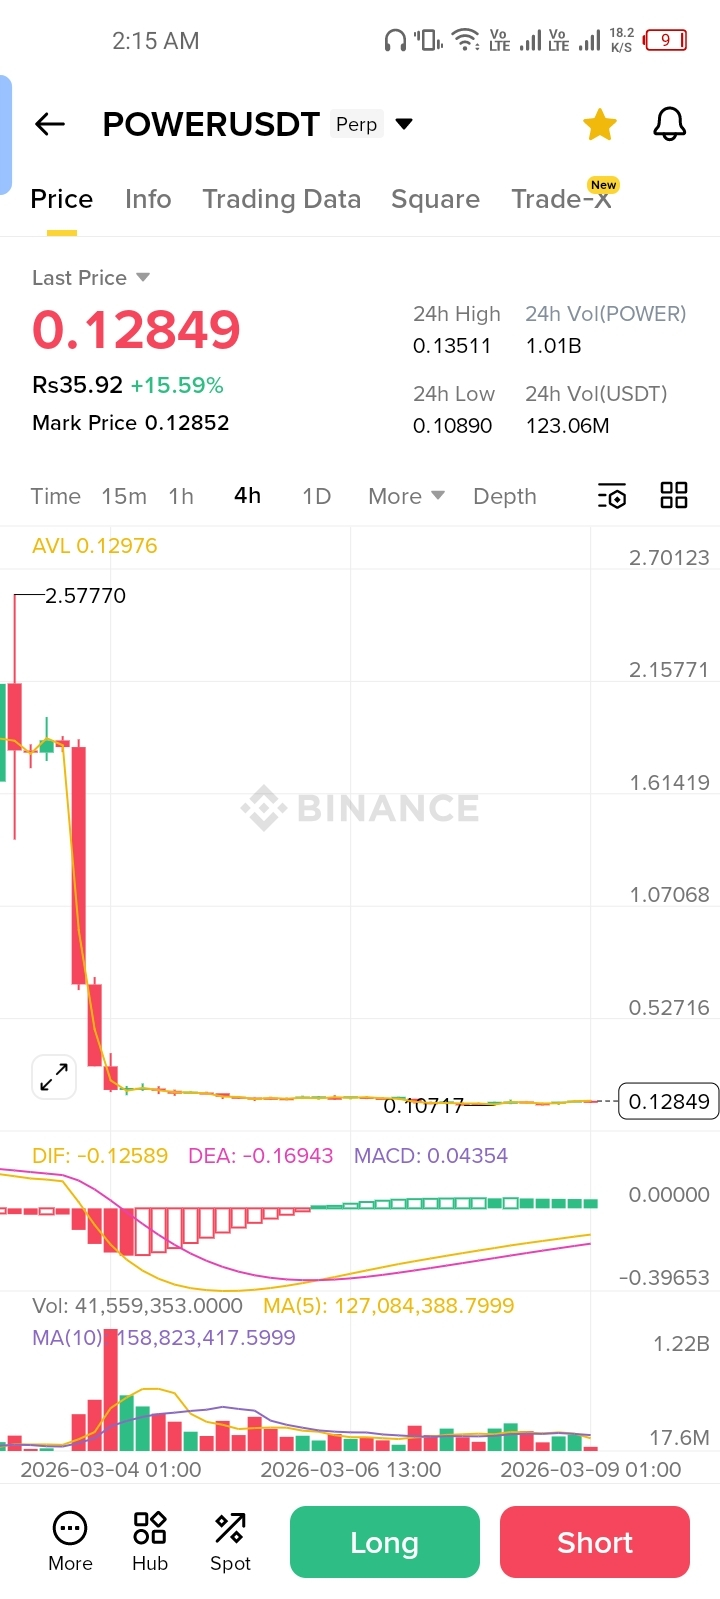
Next 24-48 hour prediction for POWER
Best LONG or SHORT entry
Whether whales are accumulating this coin
#power/usd $POWER