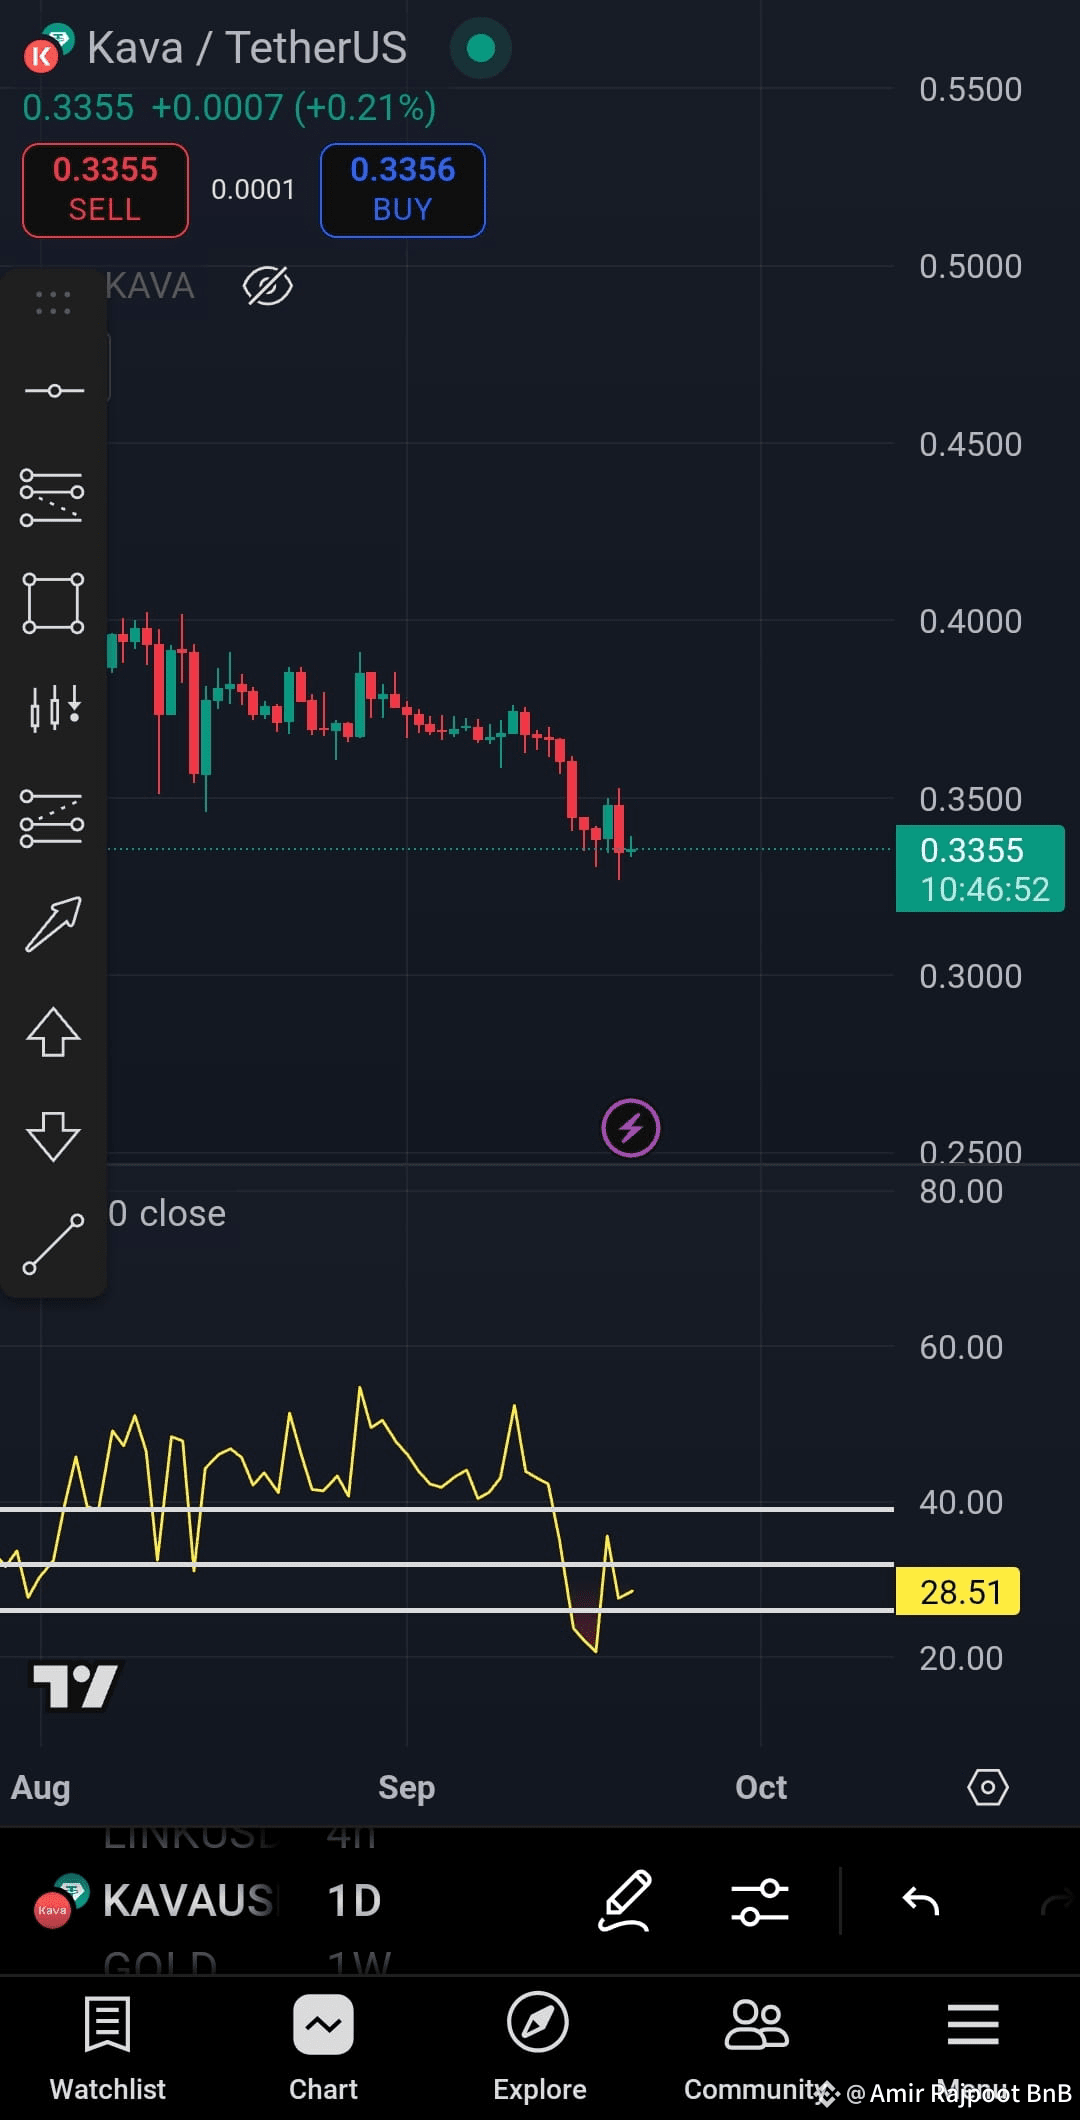

Look $KAVA daily chart 👇 my Technical Analysis
it’s still trading under key resistance levels, signaling that bears have the upper hand.
Moving Averages
MA(7): $0.3434 – short-term resistance is overhead.
MA(25): $0.3636 – medium-term trend is bearish, with price well below this level.
MA(99): $0.3914 – long-term outlook remains weak, with major resistance far above.
👉 Overall: bearish structure until KAVA reclaims the 0.343–0.345 zone and sustains momentum.
Volume is declining, showing reduced momentum. A strong push either way needs volume confirmation.
MACD: remains bearish with no clear bullish crossover yet.
Volatility: Price compression under resistance could lead to a sharper move once either bulls or bears break structure.
Key Levels to Watch
Immediate Resistance: $0.340 – $0.343 (supply block + MA(7))
Stronger Resistance: $0.361 – $0.364 (aligned with MA(25))
Support: $0.326 – $0.323 (recent low, if broken could open path to $0.310 area)
Market Structure Outlook
KAVA is in a short-term downtrend, trading below all major moving averages.
A rejection at $0.340–$0.343 may drag it back toward $0.320.
On the upside, if bulls push above $0.345 and hold, it could retest $0.361 resistance, with stronger momentum needed for a breakout.
Fundamental Angle
While the chart leans bearish, Kava’s hybrid architecture of EVM + Cosmos SDK and its IBC connectivity keep it fundamentally strong. As liquidity and cross-chain adoption grow, KAVA could attract renewed attention, but in the near term, technicals dominate.
👉 Bias: Bearish to neutral short term, bullish potential only if price reclaims 0.345+ with strong volume.
@kava #KavaBNBChainSummer $KAVA
it’s still trading under key resistance levels, signaling that bears have the upper hand.
Moving Averages
MA(7): $0.3434 – short-term resistance is overhead.
MA(25): $0.3636 – medium-term trend is bearish, with price well below this level.
MA(99): $0.3914 – long-term outlook remains weak, with major resistance far above.
👉 Overall: bearish structure until KAVA reclaims the 0.343–0.345 zone and sustains momentum.
Volume is declining, showing reduced momentum. A strong push either way needs volume confirmation.
MACD: remains bearish with no clear bullish crossover yet.
Volatility: Price compression under resistance could lead to a sharper move once either bulls or bears break structure.
Key Levels to Watch
Immediate Resistance: $0.340 – $0.343 (supply block + MA(7))
Stronger Resistance: $0.361 – $0.364 (aligned with MA(25))
Support: $0.326 – $0.323 (recent low, if broken could open path to $0.310 area)
Market Structure Outlook
KAVA is in a short-term downtrend, trading below all major moving averages.
A rejection at $0.340–$0.343 may drag it back toward $0.320.
On the upside, if bulls push above $0.345 and hold, it could retest $0.361 resistance, with stronger momentum needed for a breakout.
Fundamental Angle
While the chart leans bearish, Kava’s hybrid architecture of EVM + Cosmos SDK and its IBC connectivity keep it fundamentally strong. As liquidity and cross-chain adoption grow, KAVA could attract renewed attention, but in the near term, technicals dominate.
👉 Bias: Bearish to neutral short term, bullish potential only if price reclaims 0.345+ with strong volume.
@kava #KavaBNBChainSummer $KAVA