

Bitcoin is attempting to sustain above $20,000 and if successful, ETH, MATIC, TON, and OKB could see a strong recovery.

Traders dumped risk assets following the Silicon Valley bank crisis and collapse. The S&P 500 plunged 4.55%, while Bitcoin
Bitcoin fell about 9% last week.
The collapse of SVB has led to a crisis in the cryptocurrency sector, with USD Tokens
Central Bank of the United States
The loss of its peg to the U.S. dollar came amid reports that $3.3 billion of Circle’s $40 billion USDC reserves were held by SVB. After trading near $0.87 on March 11, USDC had climbed above $0.96 at the time of publication.
SVB's collapse adds to uncertainty in the short term, with investors watching closely for any signs of contagion to other regional U.S. banks.

In times of uncertainty, it is best to remain on the sidelines. However, if there is no domino effect following the SVB crash, some cryptocurrencies may begin to recover. The cryptocurrencies selected in the article are all trading above their 200-day simple moving average, which is a key level that long-term investors watch to determine whether an asset is in a bull or bear phase.
Let’s examine the charts of Bitcoin and four altcoins that could outperform if the sector sees a recovery in the coming days.
Bitcoin Price
Bitcoin has corrected back to the 200-day SMA ($20,389). Buyers are expected to defend this level with all their might as a break below it could intensify the selling.

On the way up, the 20-day exponential moving average ($22,042) could act as a major hurdle. If the price turns down sharply from the 20-day EMA, the BTC/USDT pair is likely to retest the support of the 200-day SMA. If this level cracks, the pair could slide to $18,400 and below it to $16,300.
If the bulls want to arrest the decline, they will have to push the price above the 20-day EMA. If they manage to do that, the pair is likely to gain momentum and surge towards the overhead resistance at $25,250.

The four-hour chart shows that the bulls are attempting to rebound from $19,550, but the bears are aggressively defending the 20-EMA. If the price turns down from the current levels, the bears will again try to sink the pair below $19,950. If they succeed, the pair can drop to $18,400.
Conversely, if the price picks up and breaks out of the 20-EMA, it will suggest that the short-term selling pressure may be easing. This could start a rally to $21,480, where the bears will again pose a strong challenge. If this level is scaled, the pair could reach $22,800.
Ethereum/USDT
Ethereum fell below the 200-day EMA ($1,421) on March 10, but the long tail of the day’s candlestick showed solid buying at lower levels.

The recovery is facing resistance near $1,461. If the price turns down from the current levels and touches the 200-day SMA, it will suggest that the bears are selling on minor rallies. This will increase the possibility of a break below $1,352. The ETH/USDT pair can then slide to $1,100.
If the bulls want to arrest the decline, they will have to push the price above the 20-day EMA ($1,548). If they do so, the pair could move up to $1,743 where the bears are likely to establish a strong barrier again. A breakout of this level will open the doors for a possible rise to $2,000.
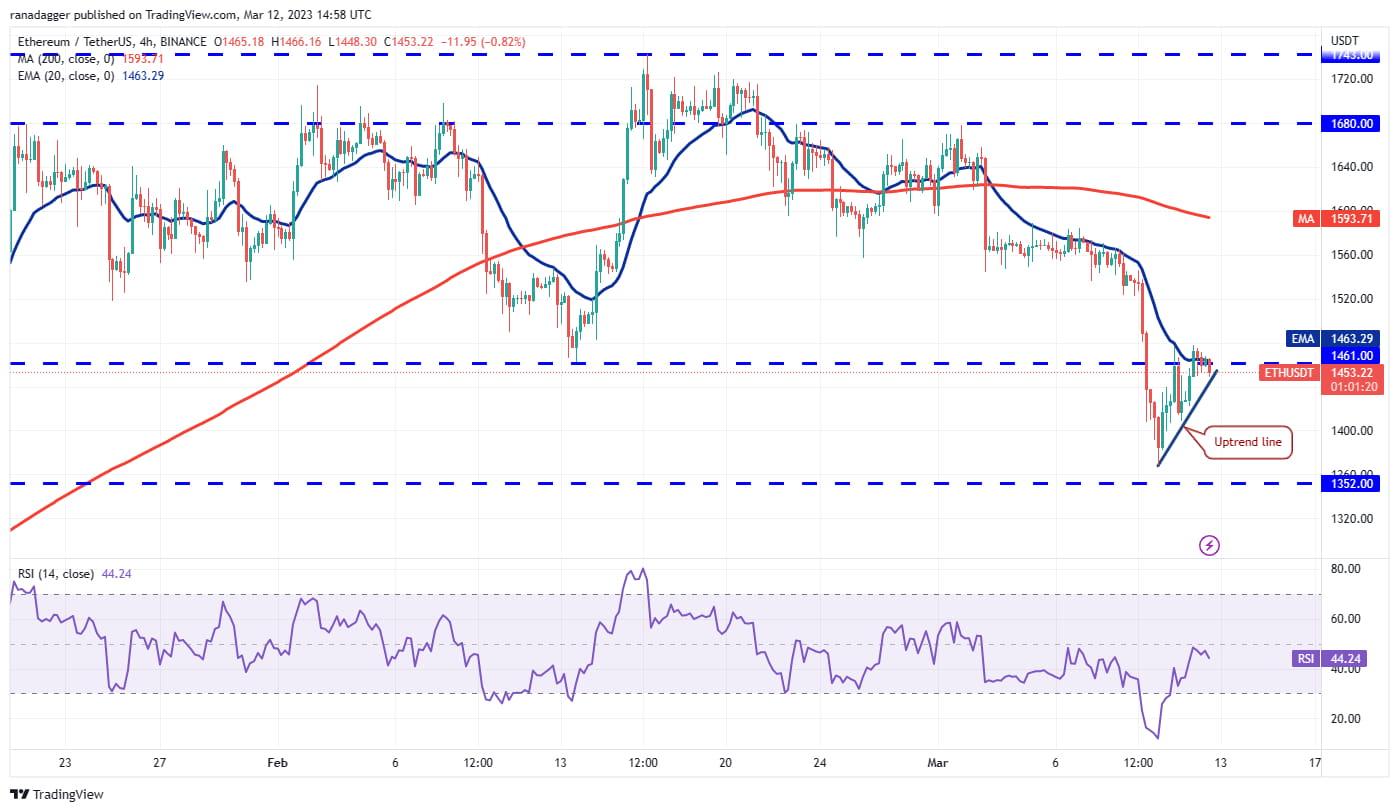
The four-hour chart shows that the pair is attempting a rebound. The 20-EMA is flattening out and the Relative Strength Index (RSI) is just below the midpoint, suggesting a balance between supply and demand.
The balance will tilt in favor of the buyers if they push and sustain the price above $1,500. If they do, a relief rally to $1,600 is likely. On the other hand, if the price turns down and breaks below the uptrend line, the advantage is likely to tilt in favor of the bears. The pair is then likely to retest the strong support of $1,352.
Bitcoin/USDT
Marty corrected sharply from $1.56 on February 18 and touched the 200-day SMA ($0.94) on March 10. The long tail on the day’s candlestick suggests that the bulls are fiercely defending the level.

The bulls will try to push the price above the 20-day EMA ($1.15), where the bears are likely to defend strongly. If the price turns down from this level, it will suggest that sentiment remains negative and traders are selling on rallies.
This could increase the possibility of a break below the 200-day moving average. If this happens, the MATIC/USDT pair could drop to $0.69.
Conversely, if the buyers push the price above the 20-day EMA, it will indicate that the bulls are back in control. The pair can then move up to the overhead resistance at $1.30.

The rebound from $0.94 has reached the 20-EMA. This is an important level to watch closely because if the price sustains above it, the pair could rally to $1.15.
This level may again act as a stiff resistance but if the bulls arrest the next decline above $1.05, it will suggest that the downtrend might be over. This could open the doors for a move to $1.30.
This positive view will be invalidated in the short term if the price turns down and breaks below the $0.94 support.
TON/USDT
While most major cryptocurrencies have fallen to or below their 200-day moving average, Toncoin (TON) remains well above it. This suggests that traders are in no rush to exit.
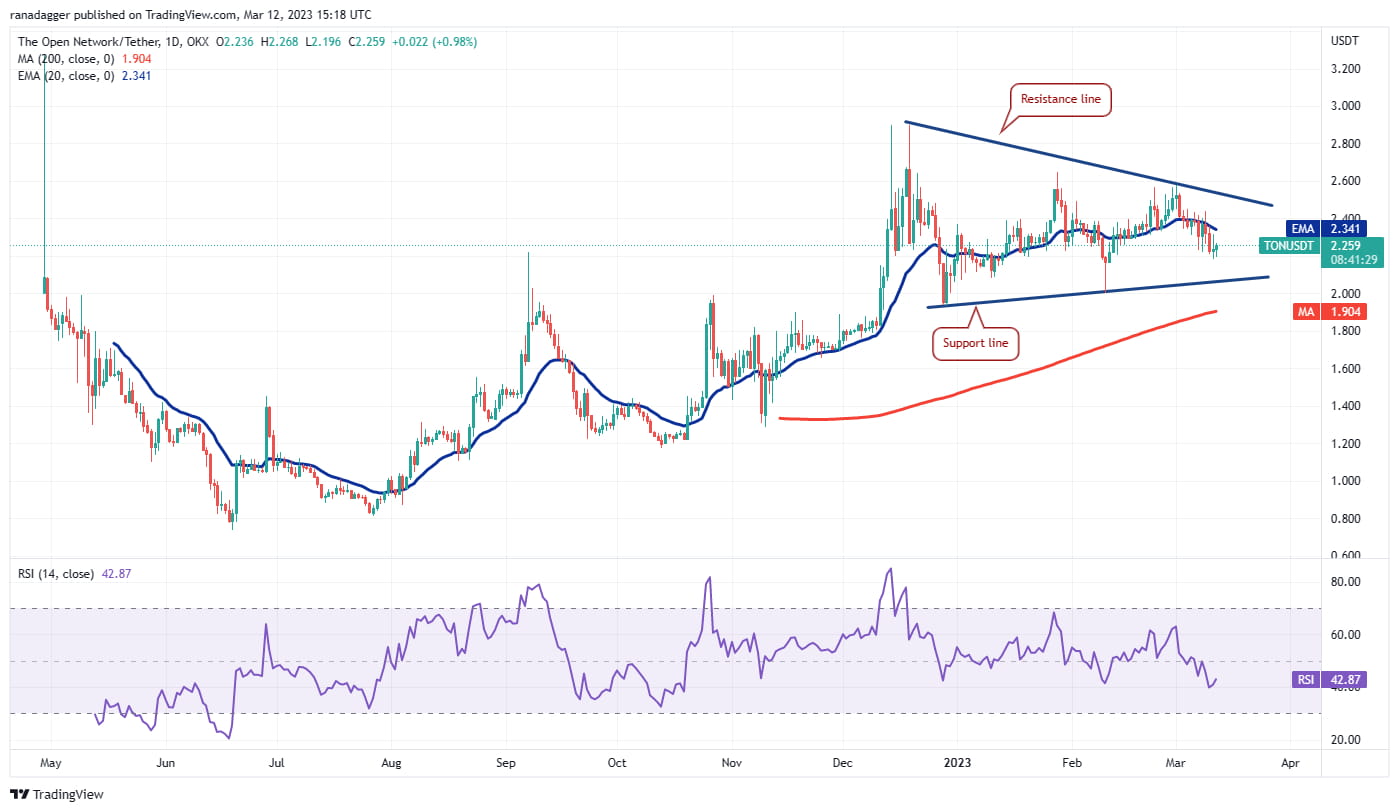
The TON/USDT pair has formed a symmetrical triangle pattern near local highs. The price action within the triangle is random and volatile.
Usually, triangles act as continuation patterns. This means that the trend is valid until the setup resumes. In this case, if the buyers push the price above the resistance line of the triangle, the pair could start a move towards $2.90.
Conversely, if the price continues to move lower and breaks below the triangle and the 200-day EMA ($1.90), it will suggest that bears are in command. This could pull the price towards $1.30. Such a move will indicate that the triangle behaves as a reversal setup.

The downsloping 20-EMA and the RSI in the negative zone on the four-hour chart suggest that bears have the upper hand. If the price turns down from the current levels and breaks below $2.18, the decline can extend to $2.
Conversely, if the bulls push the price higher and sustain it above the 20 EMA, it will indicate that the bulls are attempting a comeback. The pair could then move up to $2.45, where the bears are likely to mount a strong defense. If this level is crossed, the bulls will attempt to break out of the triangle near $2.50.
OKB/USDT
OKB (OKB) is in a correction phase but a small positive factor in favor of the bulls is that it is well above its 200-day EMA ($26).

The next support on the downside is the 50% Fibonacci retracement level at $36.13 and then the 61.8% retracement level at $30.76. The bulls are likely to defend this zone with all their might.
If the price turns around from this zone, the OKB/USDT pair could move up to the 20-day EMA ($45.48). This is an important level to watch closely because a breakout and close above it will suggest that the corrective phase might be over.
On the other hand, if the price breaks below $30.76, it will suggest that traders are in a hurry to exit the market. The pair can then drop to the 200-day EMA.

The downsloping 20-EMA on the four-hour chart and the RSI in the negative territory suggest that bears have the upper hand. There is a minor support near $37.50, but if it gives way, the pair could reach $36.13.
Conversely, if the price picks up and breaks out of the 20-EMA, it will suggest that the bulls are trying to regain control. The pair could then move up to $44.35. This is an important resistance for the bears to guard against because if it is taken out, the price could reach $50.