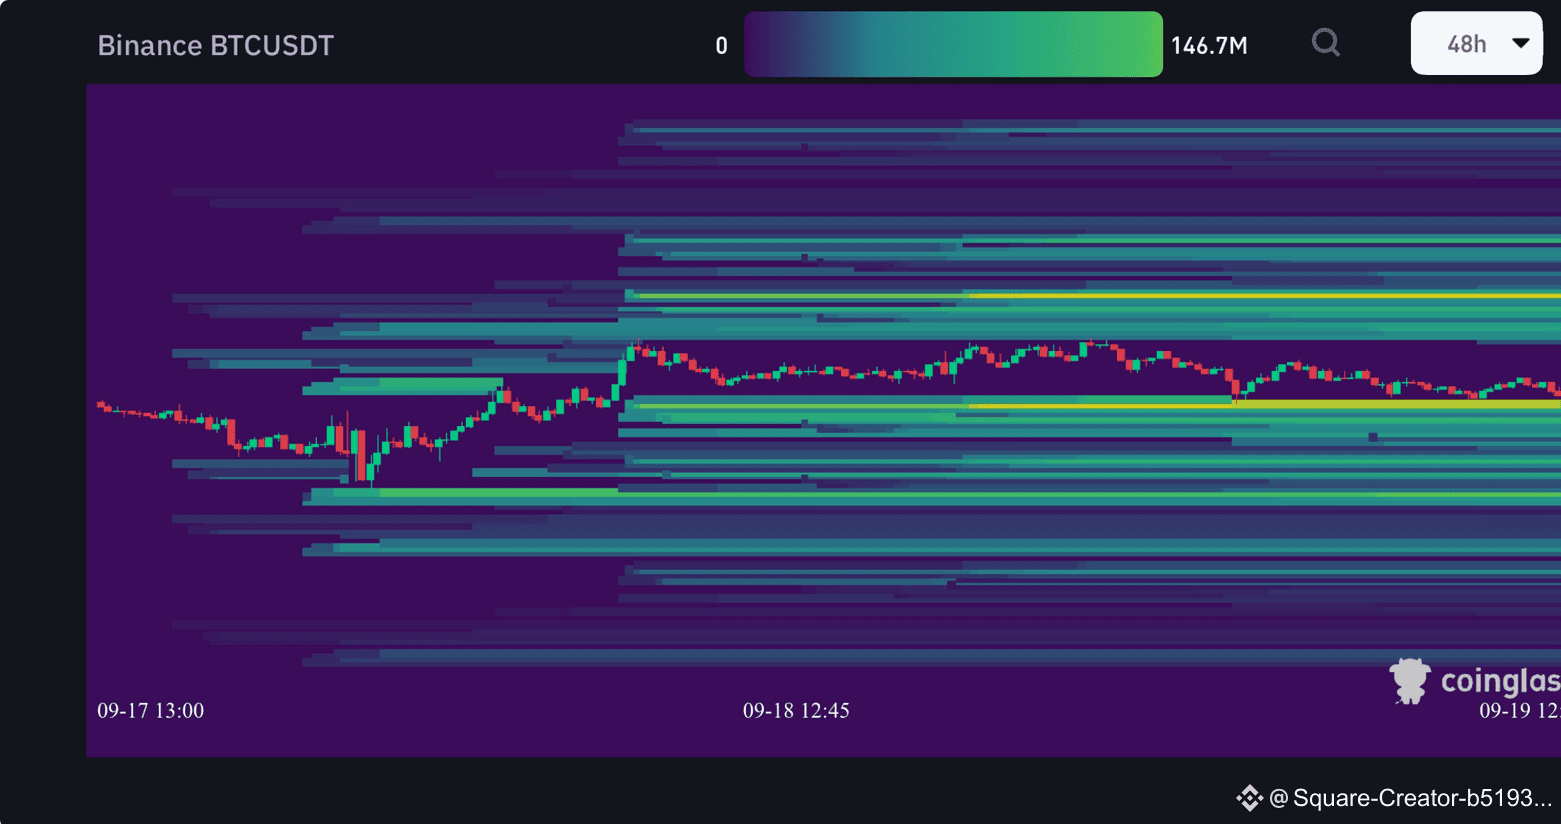
Long Liquidation Areas
Light colors (Green–Yellow–Light Blue) = Areas with higher liquidity and potential liquidations.
Dark colors (Purple/Dark Blue) = Areas with lower liquidity.
The wavy red/green line = Actual Bitcoin price movement over time.
📊 Key Liquidation Areas (Long) shown:
Area around 116,000 – 115,500 USDT:
There is a significant accumulation (Yellow/Light Green), which means there is a large amount of long positions that could be liquidated if the price breaks below.
Area around 113,500 – 112,800 USDT:
On the map, there is a strong block of liquidity (very bright), if the price drops to it, we might see massive liquidations for Long.
Area below approximately 110,000 USDT:
At the bottom of the map, there are visible light yellow and green areas, which are usually large long positions with high leverage. Liquidating them could cause a sharp drop.
⸻
⚠️ Notes:
This map reflects the last 48 hours, meaning a real-time update based on data from Binance.
The lighter and stronger the color → the higher the likelihood of liquidation if the price touches the area.
Large traders (whales) often target these areas to accumulate liquidity.