

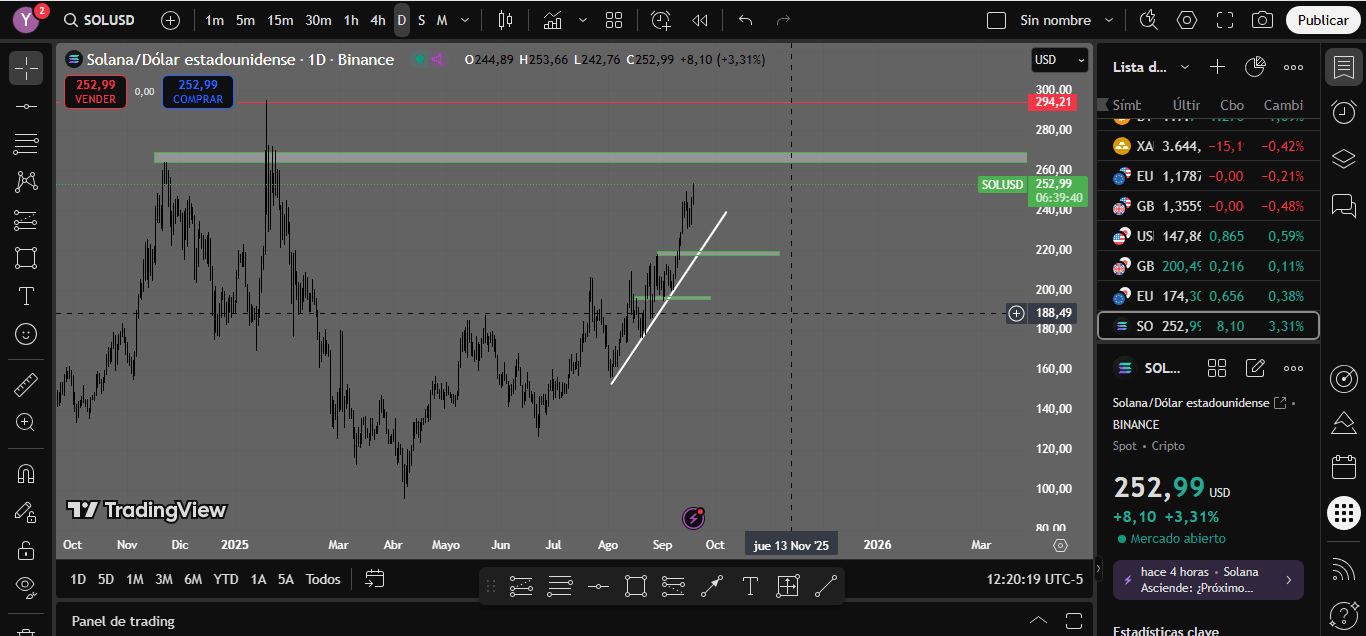
🔎 Technical Analysis of the Chart
Current price: $251.54 (+2.72%).
It is in a clear bullish trend, with a dynamic support line (marked in white) that supports the advance.
Important zones:
Supports:
$230 (first support, validation zone of the rise).
$200 (strong and psychological support).
$127 (last solid base if the market corrects strongly).
Resistances:
$260 (immediate ceiling zone).
$294 (maximum resistance marked on your chart, before $300).
Above $300 → clear path to new all-time highs.
Market structure (cycles):
Solana closed its bearish cycle in 2022 (zone of $8 – $10).
Since then it has had an impressive recovery → confirmation of the expansive phase of the cycle.
Today it is in a pre-distribution zone (high resistances), but still with bullish strength.
Current trend:
It follows a clean bullish channel.
As long as it stays above $230, the trend is considered solid.
📈 Conclusion for Holder
Short term (2025):
It can try to break $260 and test $294.
If it surpasses $300, the market would enter a FOMO explosion → possible rapid rise.
Medium term (2026, crypto bullish cycle):
Reasonable targets: $400 – $500.
In case of a very strong cycle: $600+.
Long term (2027+ if Solana remains a top L1):
Possibility of surpassing its previous ATH ($260+) and marking new highs at $700 – $1,000 depending on institutional capital flow and adoption.
⚠️ Risks:
If the price drops below $230 and especially $200, it could correct deeper towards $127.
Solana is strong in technology and adoption, but also very sensitive to competition from other L1s (like AVAX, SUI, Aptos, etc.).
👉 Summary: For a holder, Solana remains one of the strongest bets in the crypto ecosystem. Buying on corrections near $200 – $230 is optimal. Holding long-term can yield returns of 2x to 4x in the next global bullish cycle.