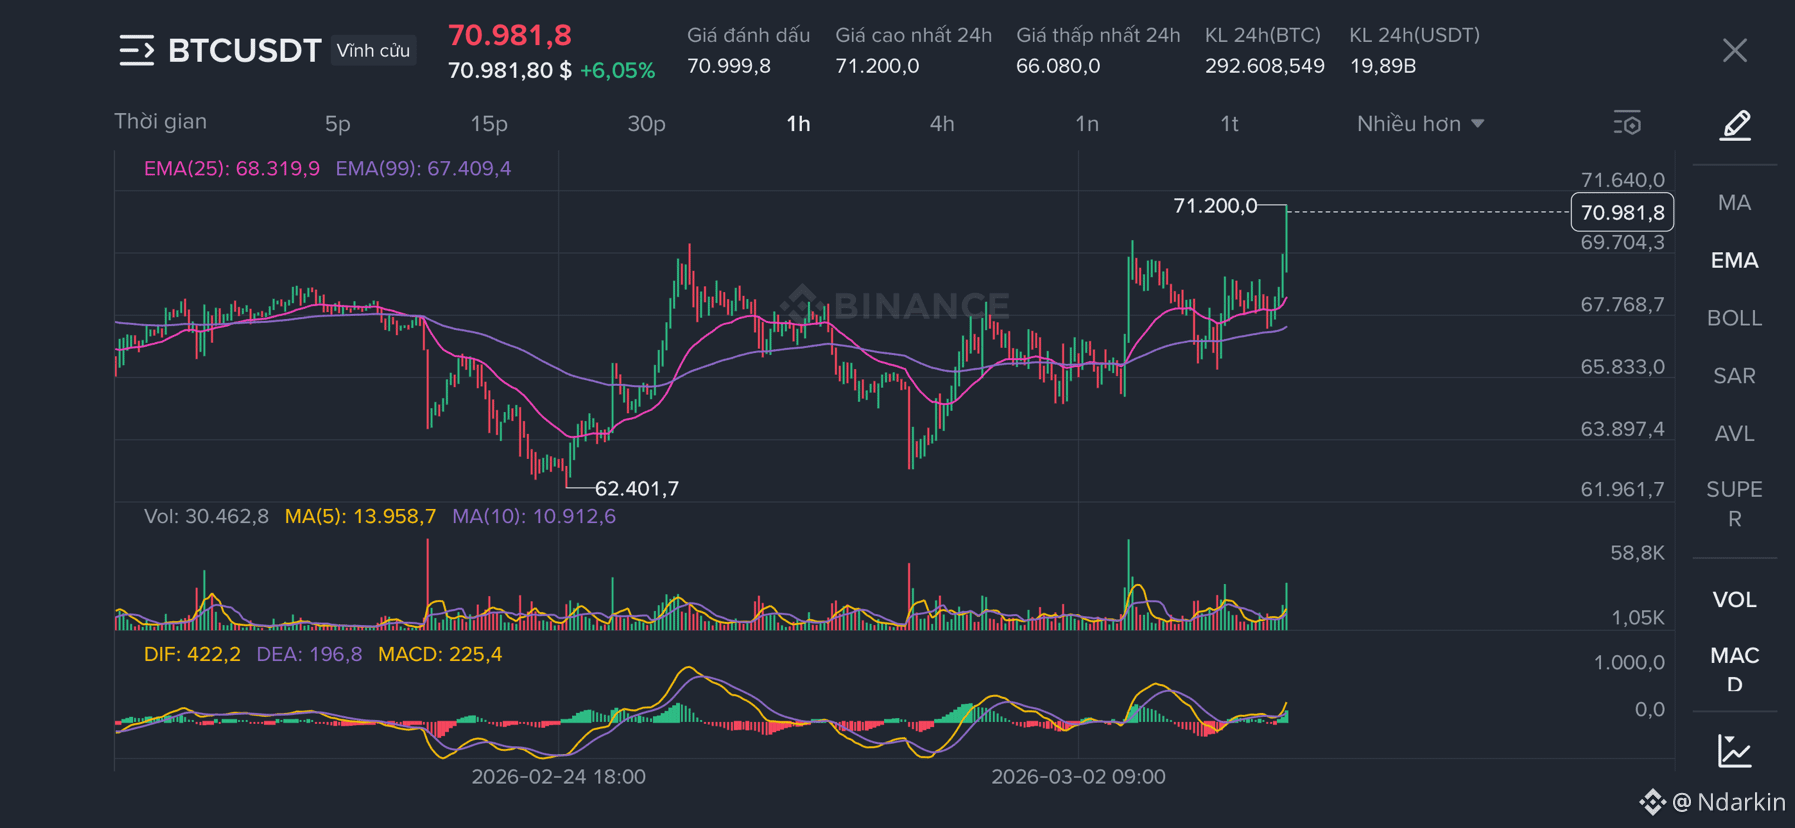
Current overview (1H frame) #BTC
• Price: ~70,980$
• Recent peak: 71,200$
• EMA25: ~68,319$
• EMA99: ~67,409$
• MACD: currently positive, DIF above DEA
• Volume: has a spike when breaking up
👉 Short-term structure: Clear uptrend on the 1H frame
1️⃣ Trend & EMA
• Price is above EMA25 and EMA99
• EMA25 crossed above EMA99 previously → uptrend confirmed
• All correction phases bounce back from EMA
➡ This is a form of “strong trend”, no signs of structure breaking yet
2️⃣ Important resistance – support area$
🔴 Resistance:
• 71,200$ (peak just tested)
• If a strong break → next target: 71,600 – 72,000$
🟢 Support:
• 69,700$ (old accumulation area)
• 68,300$ (EMA25)
• 67,400$ (EMA99 – strong support)
If breaking below 69.7k → easily retracing to test 68k
3️⃣ MACD
• MACD is expanding positively
• DIF > DEA
• Green histogram increasing again
👉 Momentum is still leaning towards the buying side.
4️⃣ Next scenario
✅ Bullish scenario (higher probability than current):
• Slight sideways around 70.5k – 71k
• Decisive break above 71.2k
• Rise to 71.6k – 72k
❌ Bearish scenario:
• Strong pullback from 71k
• Losing 69.7k
• Possible retracement to 68k
Only long when:
• There is a 1H candle closing above 71,200$
• Volume increases accordingly
📌 Entry: 71,300 – 71,500
📌 SL: below 70,600
📌 TP: 71,800 – 72,200
👉 This is a momentum trade, higher probability
⚠️ Peak-catching trade (more dangerous) – SHORT
Only short if:
• Price touches 71,200 but pulls back strongly
• A large red candle appears
• Losing again 70,800
📌 Entry: when losing 70,800
📌 SL: above 71,300
📌 TP: 69,800 – 70,000
👉 This is a technical retracement trade. $BTC
• Price: ~70,980$
• Recent peak: 71,200$
• EMA25: ~68,319$
• EMA99: ~67,409$
• MACD: currently positive, DIF above DEA
• Volume: has a spike when breaking up
👉 Short-term structure: Clear uptrend on the 1H frame
1️⃣ Trend & EMA
• Price is above EMA25 and EMA99
• EMA25 crossed above EMA99 previously → uptrend confirmed
• All correction phases bounce back from EMA
➡ This is a form of “strong trend”, no signs of structure breaking yet
2️⃣ Important resistance – support area$
🔴 Resistance:
• 71,200$ (peak just tested)
• If a strong break → next target: 71,600 – 72,000$
🟢 Support:
• 69,700$ (old accumulation area)
• 68,300$ (EMA25)
• 67,400$ (EMA99 – strong support)
If breaking below 69.7k → easily retracing to test 68k
3️⃣ MACD
• MACD is expanding positively
• DIF > DEA
• Green histogram increasing again
👉 Momentum is still leaning towards the buying side.
4️⃣ Next scenario
✅ Bullish scenario (higher probability than current):
• Slight sideways around 70.5k – 71k
• Decisive break above 71.2k
• Rise to 71.6k – 72k
❌ Bearish scenario:
• Strong pullback from 71k
• Losing 69.7k
• Possible retracement to 68k
Only long when:
• There is a 1H candle closing above 71,200$
• Volume increases accordingly
📌 Entry: 71,300 – 71,500
📌 SL: below 70,600
📌 TP: 71,800 – 72,200
👉 This is a momentum trade, higher probability
⚠️ Peak-catching trade (more dangerous) – SHORT
Only short if:
• Price touches 71,200 but pulls back strongly
• A large red candle appears
• Losing again 70,800
📌 Entry: when losing 70,800
📌 SL: above 71,300
📌 TP: 69,800 – 70,000
👉 This is a technical retracement trade. $BTC