


Bitcoin begins March 2026 stabilizing near $65,000 despite escalating Iran tensions, while traders debate downside targets as low as $45,000. Here are five critical factors shaping BTC this week.
1. Bitcoin Avoids Panic Sell-Off After Iran Escalation
Despite geopolitical shockwaves following U.S.–Iran conflict developments, Bitcoin briefly dipped toward $63,000 before rebounding and defending the $65,000 area.
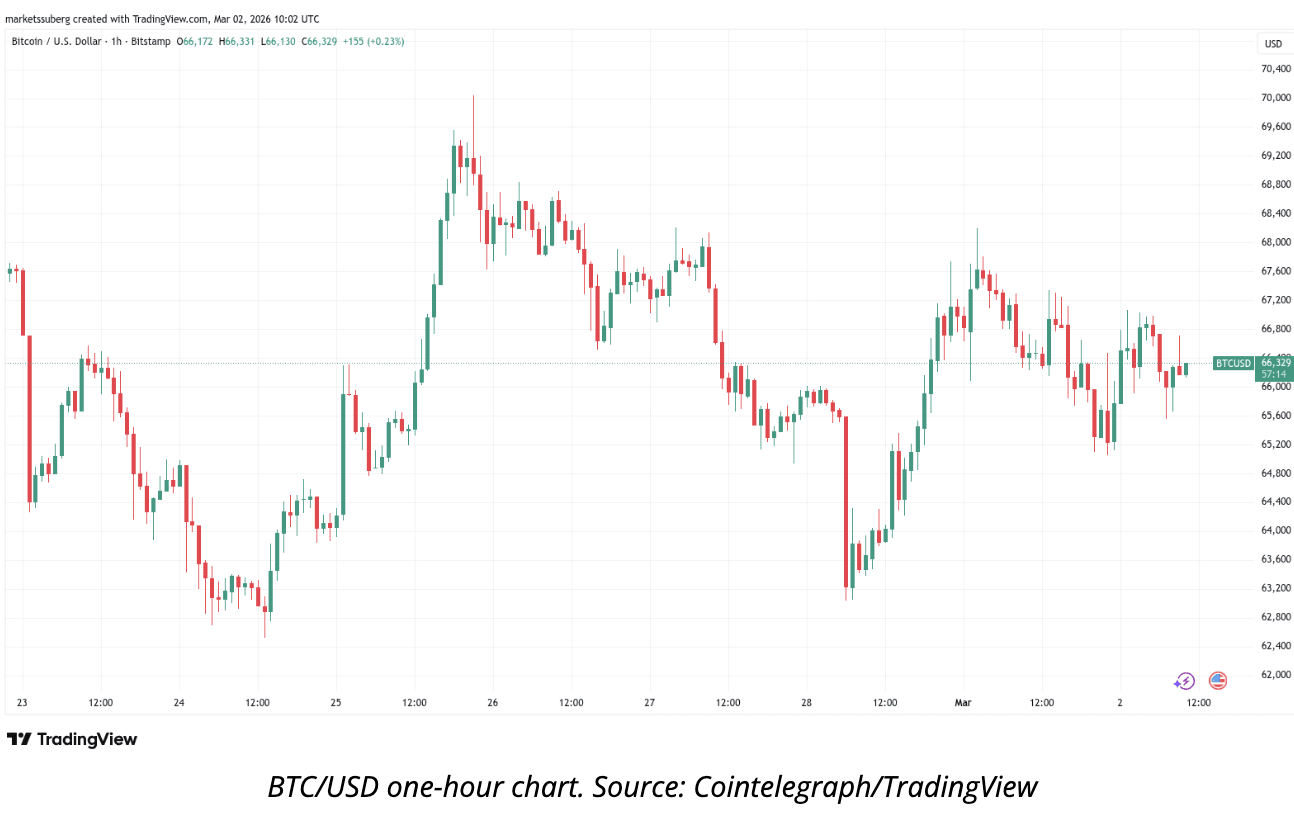
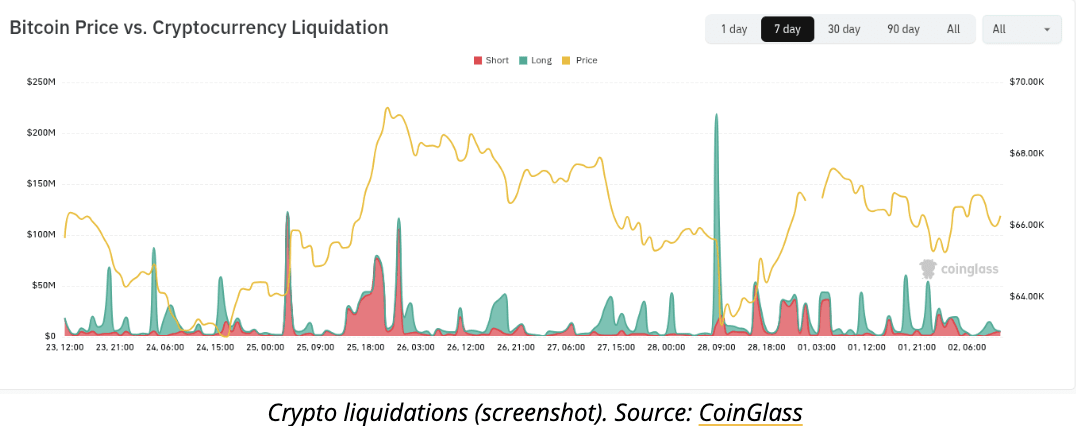
While weekend liquidity was thin, forced selling remained contained. According to market data, roughly $300 million in long liquidations were triggered — notable, but modest compared to previous deleveraging events.
Some traders are eyeing:
$62,200 as untested range support
$60,000–$61,000 as potential long-entry zones
$74,000 as a possible short-term liquidity trap
Market sentiment remains cautious but not panic-driven.
2. $45,000 Re-Emerges as Bear Market Target
Longer-term analysts are warning that historical patterns point to deeper downside.
Independent analyst Filbfilb highlighted that in past cycles, weekly closes below key long-term support bands have resulted in 40%–50% additional corrections, placing potential targets in the $40,000–$45,000 range.
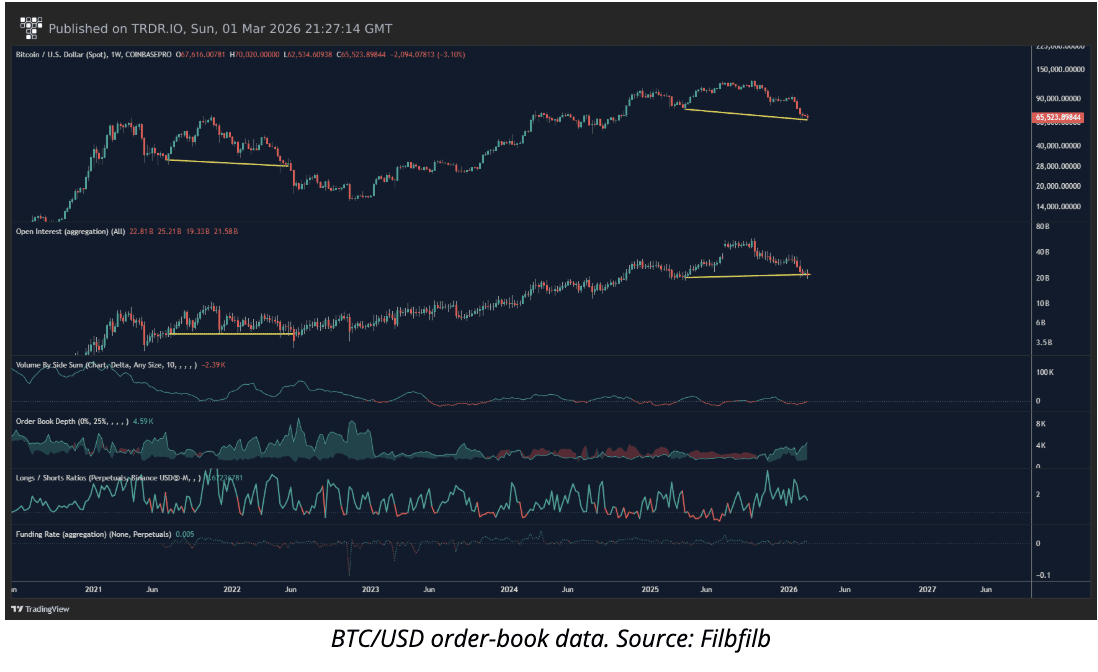
Open interest trends are also raising concerns:
Rising open interest
Falling spot price
Suggesting growing short positioning
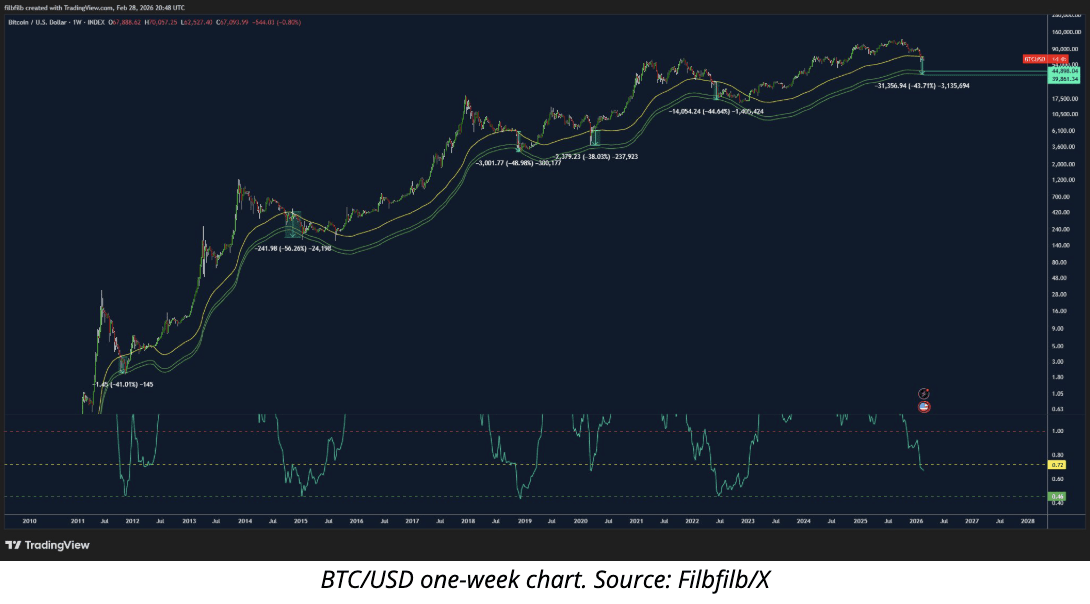
If historical drawdown patterns continue moderating, a 60%–70% cycle correction remains within statistical norms.
3. “This Is Not World War III,” Analysts Say
Despite intense headlines, several market commentators have pushed back against extreme geopolitical narratives.
Oil prices rose roughly 7% on initial Iran headlines, but analysts noted the move lacked full panic characteristics.
Trading firm QCP Capital observed that crypto positioning had already been reduced prior to the escalation, limiting forced liquidation pressure.
Market commentary from The Kobeissi Letter stated:
“This is NOT World War 3. Ignore the noise.”
Historical precedent also shows that prior Iran-related tensions in 2025 caused only temporary crypto volatility before trends resumed.
4. Inflation Risks Could Shape the Conflict’s Duration
Macro analysts are closely watching oil and inflation implications.
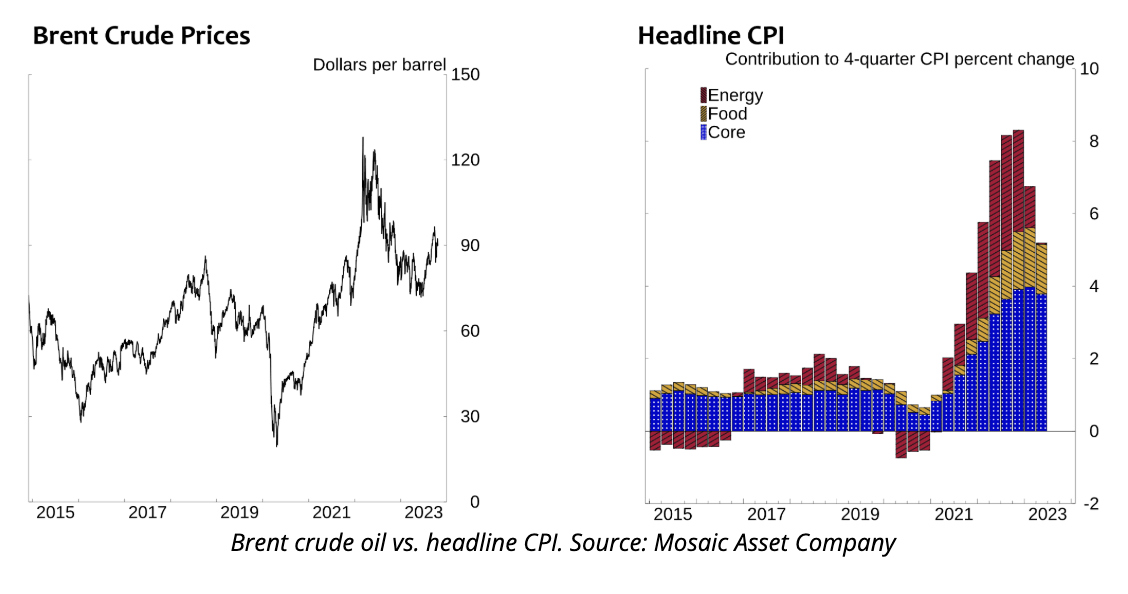
A full closure of the Strait of Hormuz could push oil above $100 per barrel, potentially driving U.S. CPI toward ~5%, according to market estimates.
Energy price sensitivity matters because:
Every $10 rise in oil may add ~0.20% to headline inflation
Higher inflation reduces odds of Federal Reserve rate cuts
Fewer rate cuts mean less liquidity for risk assets
Current CME FedWatch data shows only a 4.4% probability of a March rate cut, reflecting inflation caution.
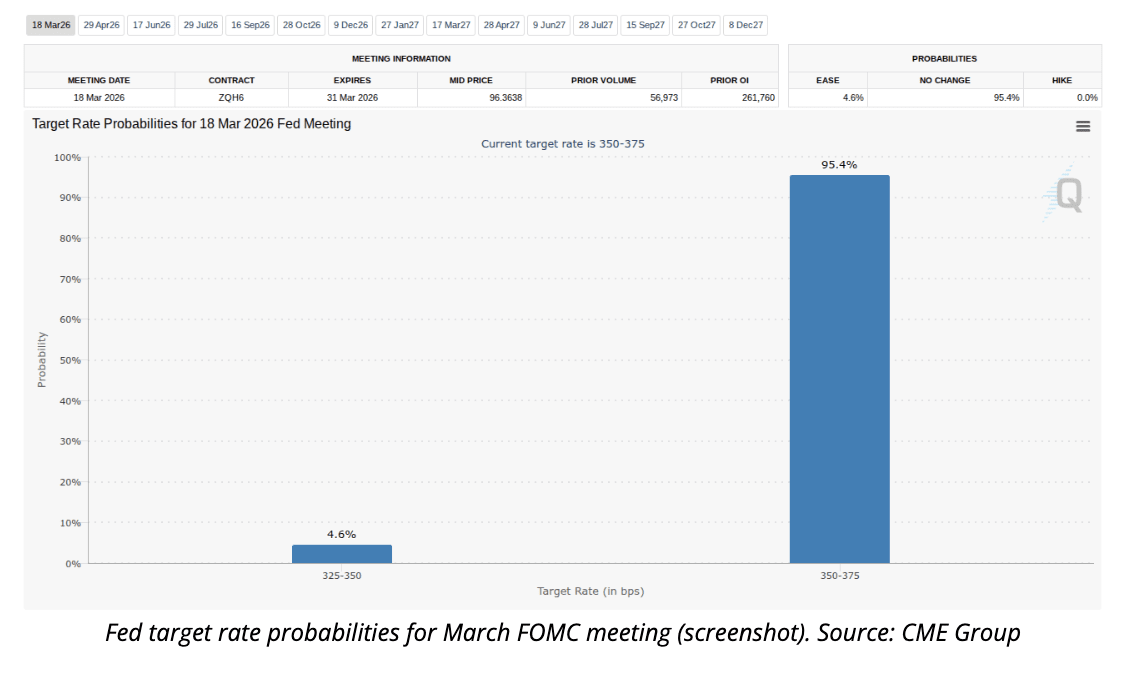
Some analysts argue that prolonged military action would conflict with domestic inflation objectives, potentially favoring a shorter engagement.
5. Bitcoin ETF Inflows Show Early Stabilization
Amid bearish technical setups, institutional flows are showing tentative improvement.
U.S. spot Bitcoin ETFs recently recorded over $1 billion in inflows across three days, marking the first meaningful accumulation wave in months.
On-chain analytics platform CryptoQuant noted this as the first notable ETF demand resurgence since Bitcoin’s $126,200 all-time high in October.
Historically:
Rising ETF demand aligns with constructive price action
Declining ETF demand aligns with price weakness
Total ETF holdings remain near 1.29 million BTC, suggesting long-term institutional capital has not fully exited.
Bottom Line
Bitcoin starts March in a fragile but controlled consolidation phase:
Support holding near $65,000
Bearish long-term targets around $45,000
Inflation risks tied to oil volatility
ETF flows stabilizing
Geopolitical fears present but not systemic
Whether BTC breaks lower or stages a recovery will likely depend on:
Oil price stability
Upcoming U.S. CPI data (March 11 release)
Sustained ETF inflows
Technical reclaim of $68,000–$72,000 resistance
For now, volatility remains elevated — but far from disorderly.