🔎 Observations
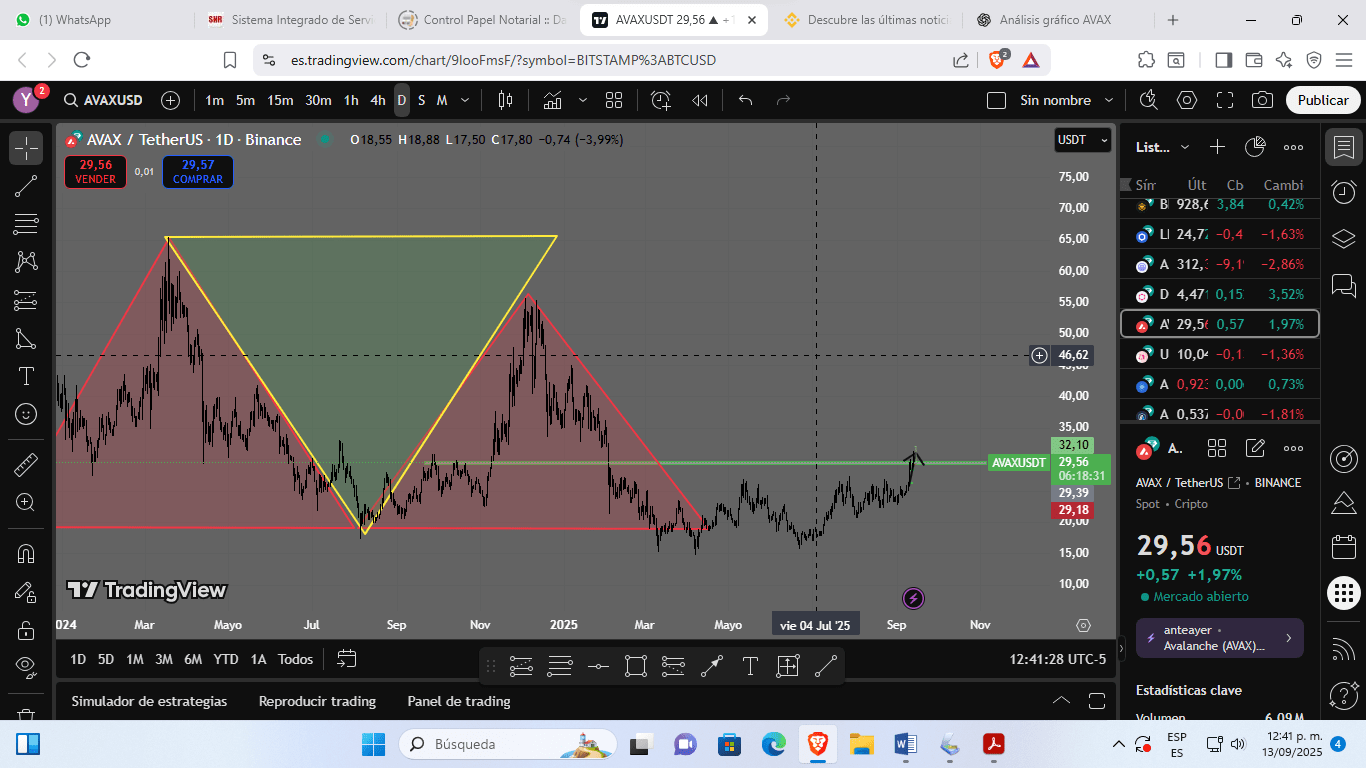
Harmonic Pattern / Double triangular structure
A movement resembling an M is observed (possible completed bearish harmonic pattern in the $75 → $10 zone).
After the drop, the price consolidated for quite some time in the lower zone ($25 – $30), showing accumulation.
Key supports and resistances
Strong support: $25 – $28 (already tested several times).
Immediate resistance: $32 (zone where it is now struggling).
Major resistance: $54 (coincides with the previous retracement and the horizontal line in your chart).
Current trend
In the short term shows bullish recovery (higher lows).The breakout of the $32 zone would confirm more strength upward.
Volume and structure
Although the volume is still not very high, buying is noticeable in the lower zone.
This may indicate accumulation by institutions for a larger movement in the future.
📈 Conclusion for future investment:
Short term (trading):
The price may rise to test the resistance of $32 – $35. If it breaks strongly, the next target would be $54.
Medium and long term (holding):
AVAX is coming from a very strong pullback and is in a discount price zone compared to its historical highs (+$140).
If the Avalanche ecosystem remains active and grows with new integrations, the price could project towards:
First target: $54
Second target: $75
Long term (2026+ with bullish market): surpass $100
⚠️ Risk: if it loses $25, it could go back to $20 or less.
👉 Suggested strategy: accumulate below $30 and wait for confirmations of resistance breaks for larger entry.