


Overview
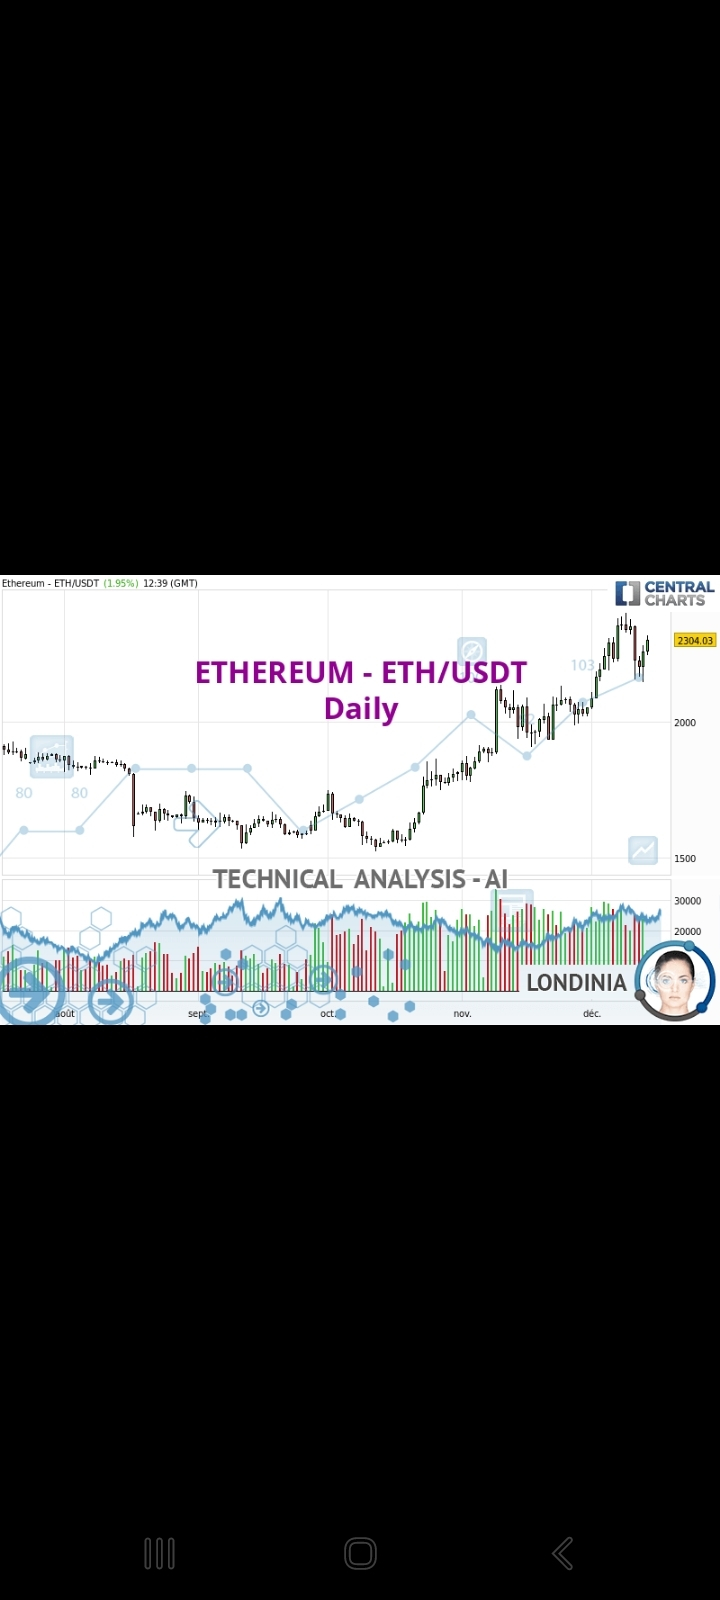
The ETH/USDT pair remains one of the most actively traded crypto pairs on Binance, reflecting strong global interest in Ethereum. As the second-largest cryptocurrency by market capitalization, Ethereum plays a central role in decentralized finance (DeFi), NFTs, and smart contract innovation.
In this article, we analyze the current technical structure of ETH/USDT, key support and resistance zones, and potential market scenarios.
Market Structure
ETH/USDT typically follows broader crypto market momentum while maintaining its own independent volatility cycles. Traders often observe:
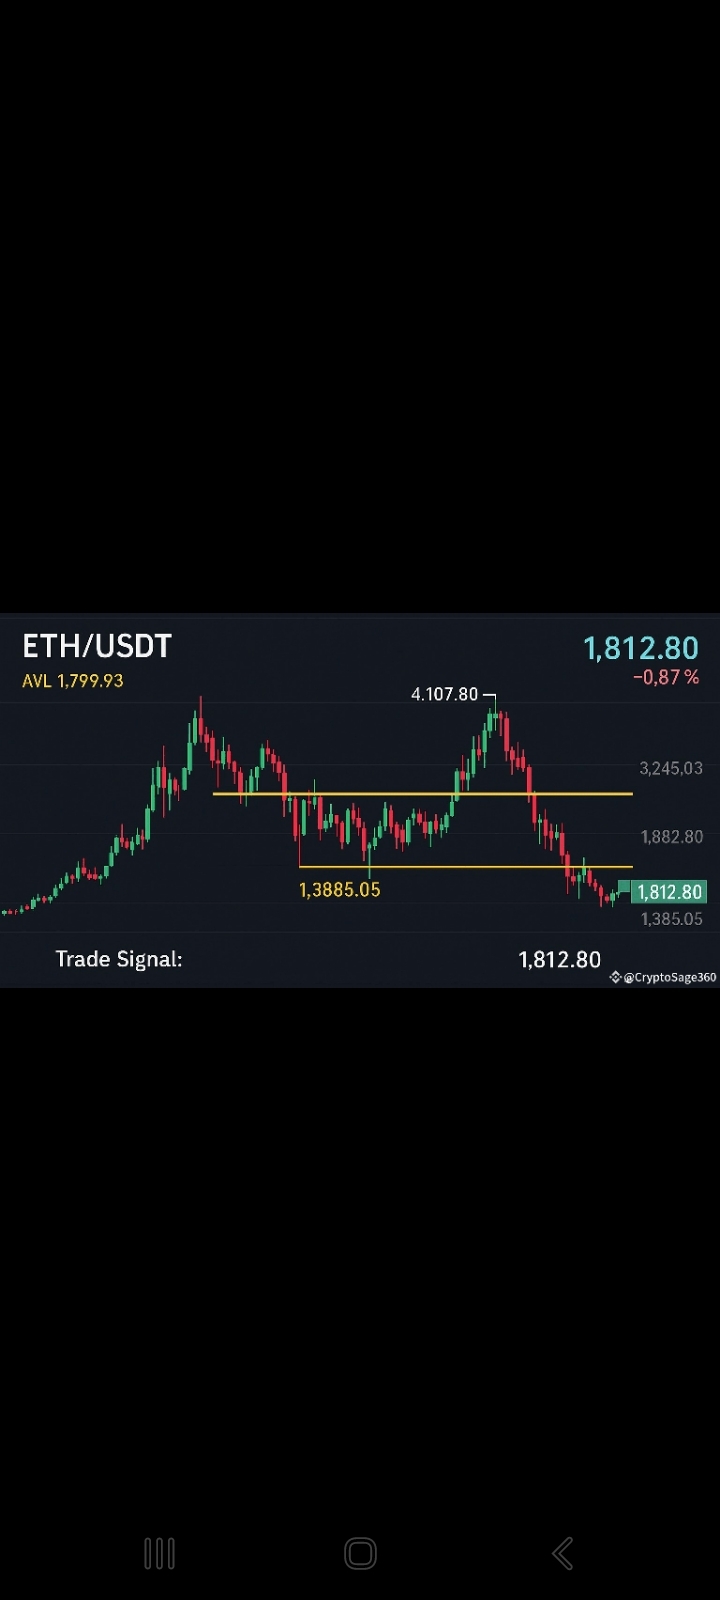
Higher highs & higher lows in bullish phases
Lower highs & lower lows in bearish phases
Sideways consolidation before breakout movements
Ethereum’s price action is highly sensitive to:
Bitcoin dominance
Network upgrades
ETF-related developments
Macro-economic news (interest rates, inflation)
Short-Term vs Long-Term Outlook
📈 Bullish Scenario
If ETH maintains higher time-frame support and breaks key resistance with strong volume, continuation toward new yearly highs becomes possible.
📉 Bearish Scenario
Failure to hold support could lead to retests of previous demand zones before recovery.
🟡 Neutral Scenario
Sideways consolidation before a breakout, especially during low volatility period
Risk Management Tips
Always use stop-loss orders
Avoid over-leverage
Risk only a small percentage per trade (1–2%)
Do not trade emotionally
Crypto markets are highly volatile. Proper capital management is essential.
Conclusion
ETH/USDT remains one of the most strategic trading pairs on Binance. Whether you are a short-term trader or long-term investor, understanding technical levels, volume behavior, and macro influences is key to navigating market volatility.
As always, conduct your own research (DYOR) and trade responsibly.