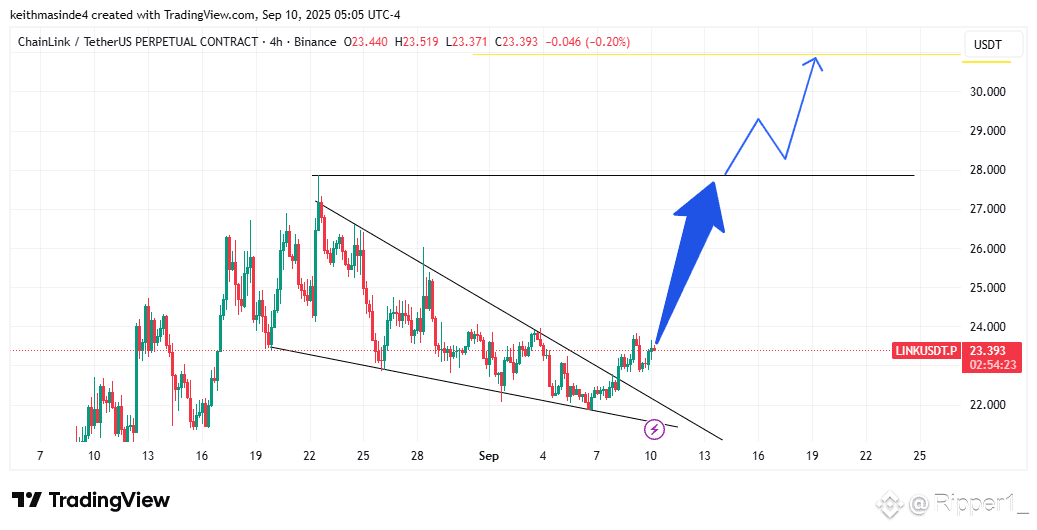
#LINK🔥🔥🔥 has officially broken out of its falling wedge pattern — a bullish signal that often precedes upward momentum. This breakout indicates renewed strength in the market.
👉 Key Level to Watch: If LINK price continues to trade above $23.5, buyers could maintain control, potentially driving the next rally toward $27.8 and even $30.9 in the short to mid-term.
⚠️ Risk Factor: On the other hand, if LINK slips back below $22, the bullish setup would weaken. This could signal that momentum is fading and might cause delays before the next leg up.
📊 Takeaway: Traders should monitor these support and resistance zones closely, as they will determine whether LINK continues its bullish momentum or enters a consolidation phase. has officially broken out of its falling wedge pattern — a bullish signal that often precedes upward momentum. This breakout indicates renewed strength in the market.
👉 Key Level to Watch: If LINK price continues to trade above $23.5, buyers could maintain control, potentially driving the next rally toward $27.8 and even $30.9 in the short to mid-term.
⚠️ Risk Factor: On the other hand, if LINK slips back below $22, the bullish setup would weaken. This could signal that momentum is fading and might cause delays before the next leg up.
📊 Takeaway: Traders should monitor these support and resistance zones closely, as they will determine whether LINK continues its bullish momentum or enters a consolidation phase.
#LINK🔥🔥🔥
$LINK
👉 Key Level to Watch: If LINK price continues to trade above $23.5, buyers could maintain control, potentially driving the next rally toward $27.8 and even $30.9 in the short to mid-term.
⚠️ Risk Factor: On the other hand, if LINK slips back below $22, the bullish setup would weaken. This could signal that momentum is fading and might cause delays before the next leg up.
📊 Takeaway: Traders should monitor these support and resistance zones closely, as they will determine whether LINK continues its bullish momentum or enters a consolidation phase. has officially broken out of its falling wedge pattern — a bullish signal that often precedes upward momentum. This breakout indicates renewed strength in the market.
👉 Key Level to Watch: If LINK price continues to trade above $23.5, buyers could maintain control, potentially driving the next rally toward $27.8 and even $30.9 in the short to mid-term.
⚠️ Risk Factor: On the other hand, if LINK slips back below $22, the bullish setup would weaken. This could signal that momentum is fading and might cause delays before the next leg up.
📊 Takeaway: Traders should monitor these support and resistance zones closely, as they will determine whether LINK continues its bullish momentum or enters a consolidation phase.
#LINK🔥🔥🔥
$LINK