


Sober Options Studio × Derive.XYZ Joint Production

Written by Sober Options Studio Analyst Jenna @Jenna_w5
1. Macro Panorama: The 'Legal Collapse' and Reconstruction of the Tariff System - A Repricing Starting Point for Macro Uncertainty
On February 20, 2026, the global capital markets experienced a far-reaching institutional shock: The U.S. Supreme Court officially ruled that the large-scale tariff measures previously implemented by the U.S. government under the International Emergency Economic Powers Act (IEEPA) lacked clear legal authorization.
This ruling not only undermines the core legal foundation of the U.S. tariff system over the past year but also directly triggers a comprehensive reconstruction of the tariff policy, fiscal revenue, international trade relations, and the risk pricing logic of financial markets.
The key significance of this ruling is not just 'cancellation of part of the tariffs', but rather fundamentally denies the president's legality to unilaterally impose broad tariffs through 'emergency powers' during peacetime. The IEEPA was originally designed to respond to national security emergencies, with its core goal being to restrict financial transactions and freeze assets, rather than establish a long-term tariff system.
However, over the past year, the U.S. government has expanded it into a global tariff tool, implementing 'reciprocal tariffs' and so-called 'fentanyl tariffs' on almost all trading partners, accumulating over $175 billion in tariffs, accounting for nearly 0.6% of U.S. nominal GDP.
The legal foundation of this system has been overturned, resulting in three direct consequences:
First, the legality of tariff revenues has fundamentally shaken. Theoretically, U.S. importers have the right to apply for refunds of previously paid tariffs, and currently, over 1,500 companies, including large retailers like Costco, have initiated litigation. If the final confirmation of refund amounts approaches the market estimate of $175 billion, this will constitute a rare 'fiscal reverse transfer'—releasing liquidity from the government to the corporate sector.
Secondly, the U.S. tariff system has returned from 'unlimited authorization' to the 'limited authorization' framework. The advantage of IEEPA lies in its broad coverage, rapid implementation, and almost no clear limits, while its alternative legal tools—such as Clause 122, Clause 301, or Clause 232 of the Trade Expansion Act of 1962—have implementation conditions, time limits, or industry restrictions. This means that while the U.S. government still has the ability to impose tariffs, its flexibility and deterrent power have significantly decreased.
Third, the uncertainty of trade policy has significantly increased. Compared to certain high tariffs, what makes the market more uneasy is the 'legal uncertainty'. Whether the tariffs are legal, whether refunds are possible, and whether they will be re-imposed have all entered the stage of judicial and political gamesmanship; this kind of institutional uncertainty often triggers risk asset volatility more easily than economic variables themselves.
After the ruling was announced, Donald Trump quickly took action, announcing the implementation of a new 'global uniform tariff' under Clause 122 of the Trade Act of 1974, raising the rate from 10% to 15%, valid for 150 days. This reaction reveals an important signal: the White House does not intend to accept the 'contraction of the tariff system', but instead seeks to maintain tariff pressure through legal restructuring.
But Clause 122 itself has obvious limitations:
Firstly, the duration is limited. The longest is only 150 days; if it is to be extended, it must gain congressional approval, and congressional uncertainty means tariffs are unlikely to exist stably in the long term.
Secondly, it lacks targeting. Clause 122 requires a uniform application worldwide and cannot implement differentiated tax rates like IEEPA or Clause 301, thereby weakening its strategic value as a negotiation tool.
Thirdly, legal risks still exist. The premise for using Clause 122 is 'serious international balance of payments issues'. Currently, the U.S. capital account has a long-term surplus, and the dollar remains the global reserve currency; whether it meets this legal condition is still in dispute and may face judicial challenges again in the future.
In other words, the U.S. tariff system is shifting from 'certain high-intensity weapons' to 'temporary tools under legal risks'.
From the perspective of future paths, tariff policies may evolve in three different directions, each having completely different impacts on the capital market:
Path One: Substantial Contraction of the Tariff System (Low Probability but Most Optimistic)
If the court restricts the use of tariff substitution tools or political resistance prevents new tariffs from being implemented long-term, the U.S. weighted average tariff rate may decline from the current approximately 12.9% to around 7%.
This scenario will bring clear macro benefits:
Economic growth rises: Corporate costs decrease, investment recovers
Inflation decreases: Prices of imported goods drop by about 20–30 basis points
Interest rates decline: Bond yield curve flattens
Dollar weakens: Trade protection reduces the demand for capital repatriation
Risk assets will significantly benefit, U.S. stock valuations will expand, and the global liquidity environment will improve, while BTC and ETH, as high-beta liquidity assets, usually perform strongest in such an environment of 'rising growth + falling interest rates'.
Essentially, this is a 'liquidity expansion risk appetite cycle'.
Path Two: Reconstruction of the Tariff System (Most Likely Path)
This is the most realistic baseline scenario: in the short term, maintain a unified tariff through Clause 122 while initiating an investigation under Clause 301, and re-establish a differentiated tariff system in the future.
This process will bring a combination of 'long-term uncertainty + short-term shock':
Delays in corporate capital expenditure
Supply chain readjustment
Increased risk of retaliation from trade partners
The typical performance of the capital market is: volatility of risk assets increases, corporate profit expectations are unstable, bond yields remain high and volatile, and the dollar is weak in the medium term but fluctuates in the short term.
For the crypto market, such an environment usually corresponds to a 'high volatility, trendless' structure, where prices lack a one-sided direction but implied volatility (Implied Volatility) rises, increasing Gamma trading opportunities.
Path Three: Full Trade Conflict Escalation (Tail Risk)
If the U.S. further invokes Clause 301 or Clause 232 to impose high tariffs on key industries, while trading partners retaliate reciprocally, the global trading system may enter a new cycle of friction.
This scenario will trigger a typical risk transmission chain: corporate profits decline → stock market falls; inflation rises → interest rates rise; growth slows → risk of stagflation.
However, BTC's performance in this environment will be more complex:
Short-term: Risk assets decline simultaneously, and BTC may drop due to liquidity contraction.
Medium-term: If the market begins to question the stability of the dollar system, BTC may turn into a 'non-sovereign asset safe haven tool'.
This is also a key trigger condition for BTC's transformation from 'risk assets' to 'macro hedging assets'.
The real core contradiction lies not in the tariffs themselves, but in the weakening of institutional stability.
Over the past year, the market has assumed that the U.S. government has a high degree of freedom in tariff implementation, while the Supreme Court's ruling has shattered this expectation, causing tariffs to revert from 'administrative tools' back to 'legal tools'. This means that future tariff policies will be slower, more uncertain, and more susceptible to judicial challenges.
From the perspective of the capital market, the essence of this change affects four dimensions:
Rising fiscal uncertainty: Tariff revenues may retract, increasing pressure on fiscal deficits
Interest rate paths are more complex: Fiscal financing needs and growth expectations are in a tug of war
Medium-term structural weakening of the dollar: Decreased credibility of policies weakens capital inflow
Volatility of risk assets is increasing: Institutional uncertainty itself is a source of volatility
For BTC and ETH, this macro change is decisive—because it directly affects global liquidity, dollar credit expectations, and the risk premium structure of risk assets. In other words, this ruling is not a trade event, but a 'macro institutional shock', whose impact cycle may last for years and become one of the most important sources of volatility in global capital markets in 2026.
2. In-depth Analysis of BTC & ETH Options Market Data
After experiencing an epic liquidity squeeze from '120,000 to 60,000', the market this week remains in a phase of oscillation and repair. By observing the volatility data provided by Amberdata & Derive.XYZ, we can clearly see how panic has receded from its peak, but defensive pricing is deeply rooted in the current term structure.
ATM IV & Skew: Bearish sentiment persists; the market collectively 'sells imagination'.
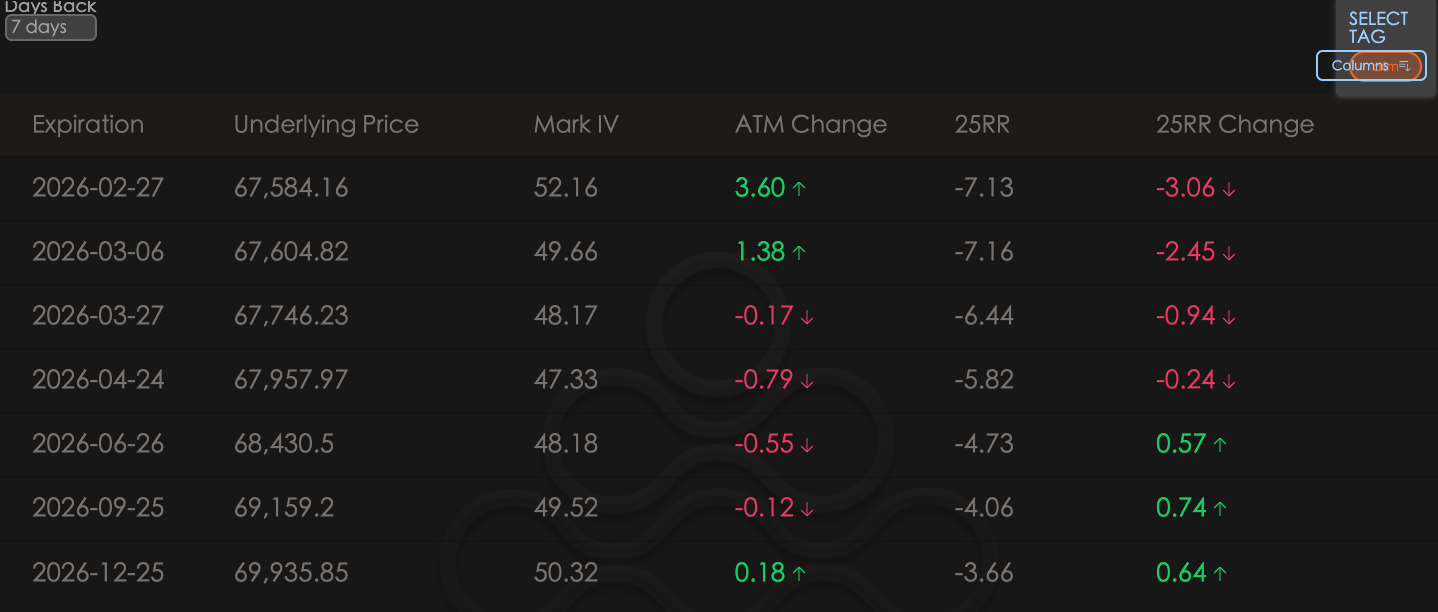
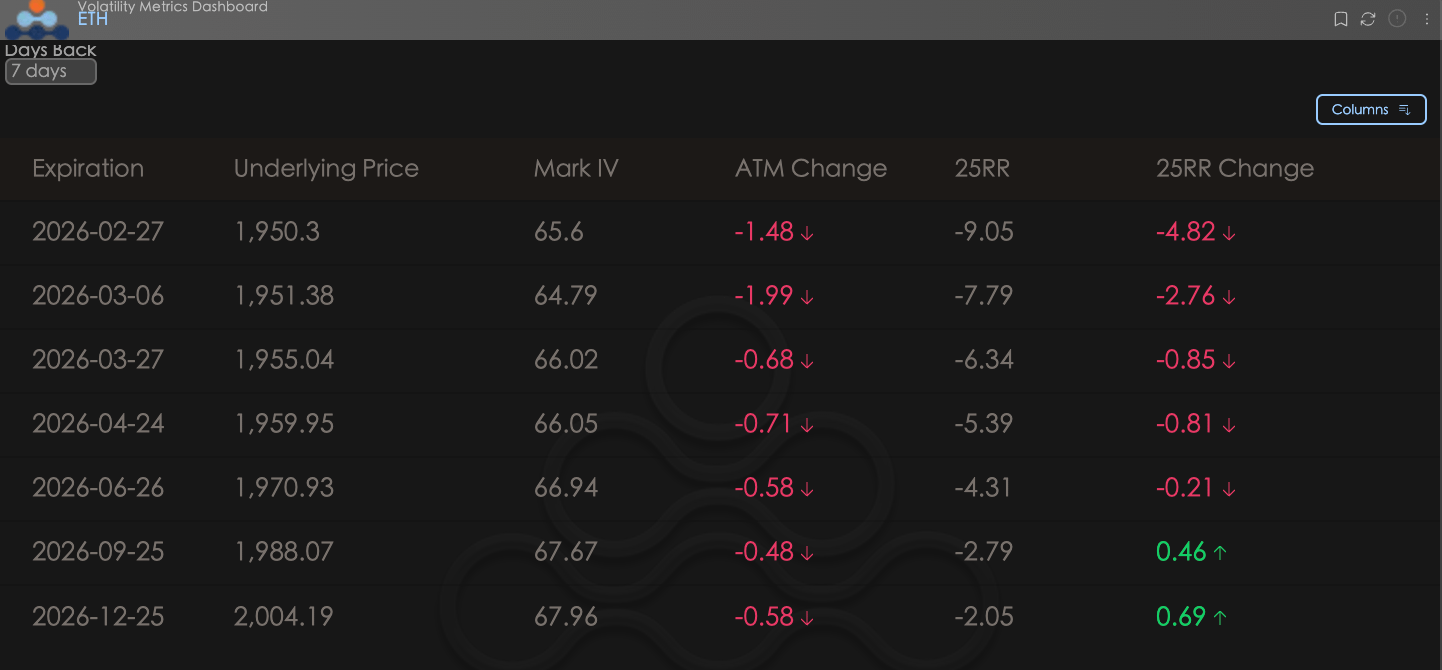
Delta 25 Skew (25RR, i.e., 25 Delta Call IV minus 25 Delta Put IV) reflects the market's preference for upward or downward directions. ATM Change reflects the recent changes in the implied volatility (IV) of at-the-money options.
Skew continues to decline: Whether for BTC or ETH, the 25RR values have decreased compared to seven days ago (negative values deepening). This indicates that after experiencing a round of sharp declines last week, the market bulls have lost confidence. A large amount of capital is conducting Sell Call operations to earn premiums, and everyone has no expectations for a recent surge in the market.
ATM (At-the-Money Volatility) Divergence: Only BTC near-term (within 1 to 2 weeks) has shown a slight increase in ATM, mainly to hedge against the short-term impacts of recent macro policies (new tariff policies being implemented); while BTC's long-term IV and ETH's IV across the board are declining. ETH's marginalization trend continues, with the market viewing it as a high Beta following asset rather than a safe haven asset.
BTC & ETH
Term Structure: Continued Inverted Shape
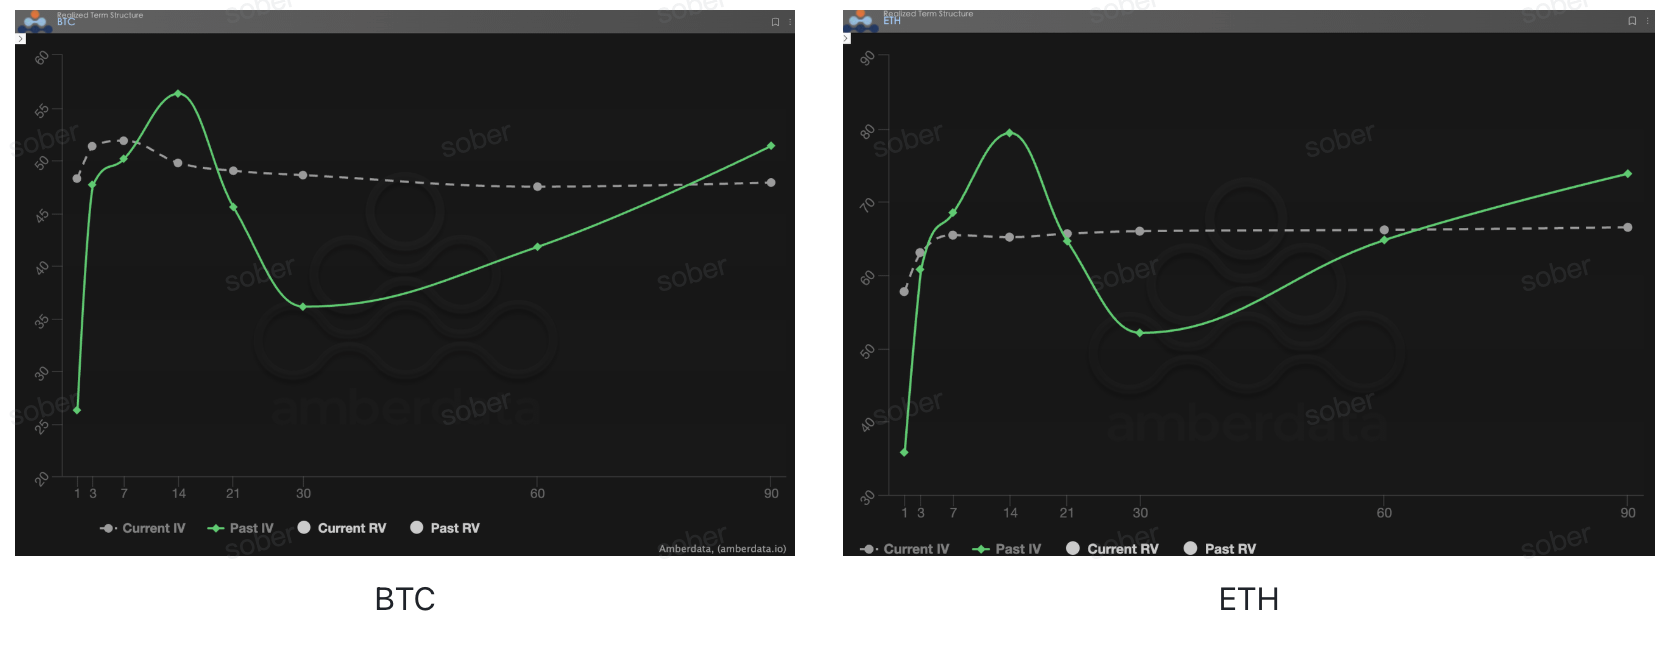
Term Structure shows the distribution of Implied Volatility (IV) for different expiration times.
Current IV (Implied Volatility) continues to be inverted: Similar to last week, the current IV curve (gray dashed line) remains inverted. However, following the recent sharp decline, the previously high IV sentiment has experienced some release, resulting in a certain degree of pullback.
Atypical 'linear' shape: The near-term IV after the pullback is currently almost equal to the far-term IV, and the entire Current IV curve is as flat as a straight line. This shape is extremely atypical, indicating that the market, after experiencing a severe blow, has fallen into a short-term 'pricing confusion'.
Comparing Past IV (Past Volatility): The green solid line (Past IV) is extremely steep at the front end, reflecting the extreme panic during the crash. The current gray dashed line has clearly flattened compared to the green solid line, indicating that the most extreme panic has passed, but the long-term volatility is still supported by the far-end demand for hedging against subsequent policy black swans.
Volatility Risk Premium (VRP): The Darkest Moment for Sellers and the 'Negative Premium' Quagmire
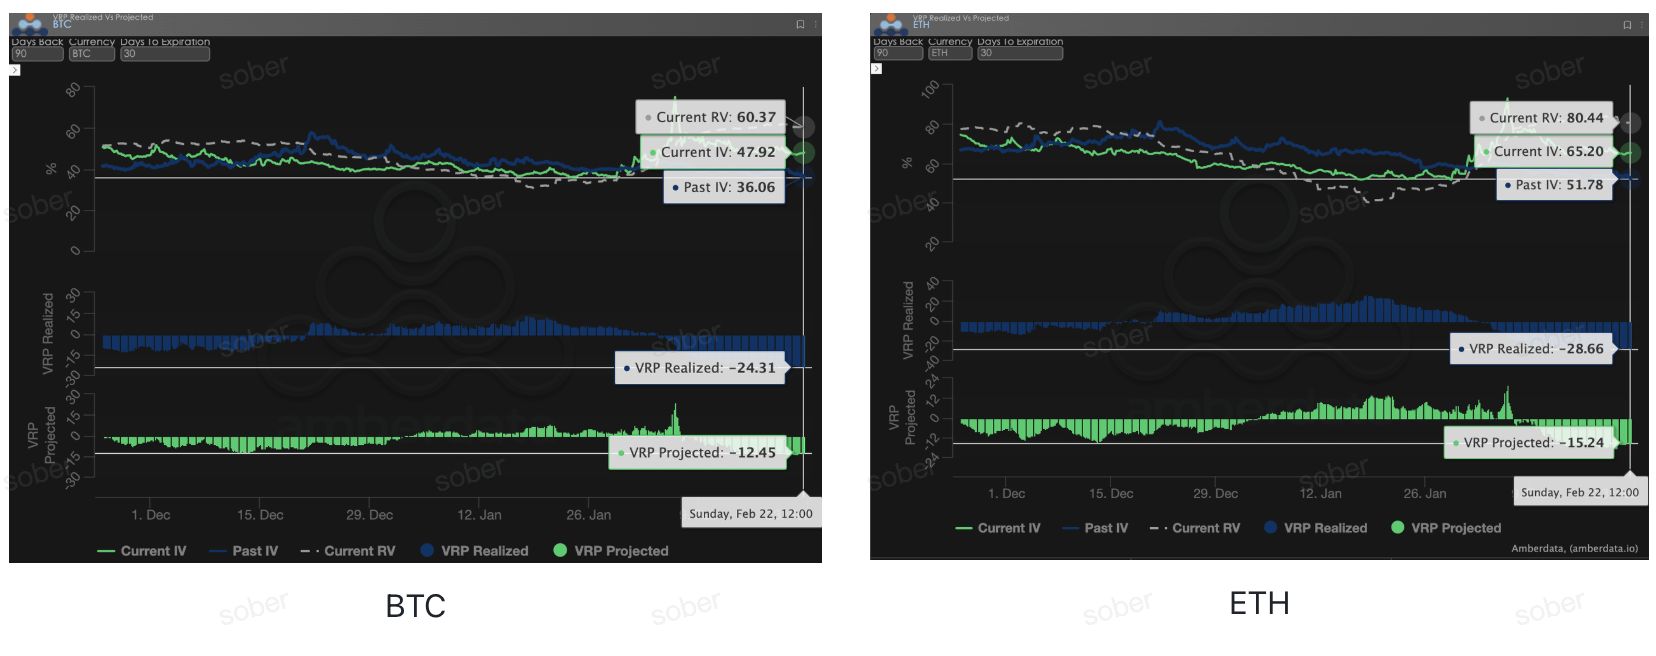
VRP (Volatility Risk Premium = Implied Volatility IV - Realized Volatility RV) is an important indicator of whether options pricing is reasonable. The current market is in a correction phase.
VRP Realized (Realized Premium) is severely negative: In the recent crash, realized volatility (RV) surged to over 60, far exceeding the IV pricing at that time. This led to VRP Realized turning deeply negative. This means that those who shorted volatility (sold options) previously, including market makers and retail investors, suffered severe bleeding losses.
VRP Projected (Projected Premium) remains low: Although volatility (RV) has continued to operate at high levels this week, the IV provided by the market still does not keep pace with RV. The current VRP Projected remains negative by over ten.
In-depth interpretation: The current options are in an awkward position of being 'undervalued but no one dares to buy, and sellers are scared to sell'. The market not only lacks imagination for price increases but also lacks imagination for further spikes in volatility.
Options Data: Trader's 'Third Eye' and Multidimensional Pricing Power
In the complex macro environment of 2026, simple price trends (Spot Price) are often lagging, while options data serves as the trader's 'third eye', penetrating the surface to see the true defensive boundaries of capital.
For different trading styles, the observed data dimensions should differ significantly:
Short-term/intraday traders (Gamma Scalpers): Should closely monitor Gamma Exposure (GEX) distribution for 1-3 dte. For instance, during the volatility period of the Federal Reserve's leadership change on January 30, the concentrated strike prices of GEX formed strong physical support and pressure, helping short-term capital to exit precisely before liquidity dried up.
Trend/swing traders: Should focus on 25 Delta Skew and VRP Projected. When Skew remains at extremely low negative values while VRP maintains high levels, it often indicates that the market is overly panicked, serving as a typical 'buying signal'.
Institutional/long-term hedgers: Need to penetrate the Term Structure to observe changes in far-end Vega. By comparing deviations between Current IV and the 90-day average, one can determine whether the current 'insurance' is overly expensive, thus deciding whether to buy Puts directly or build more complex combination strategies.
Options data provides a dual dimension of 'probability' and 'cost'. To help investors better capture these asymmetric opportunities, Sober Options Studio now offers [Customized Options Data Tracking Research Reports] service, providing in-depth profiles tailored to your specific positions and risk preferences. Please feel free to inquire.
3. Options Strategy Recommendation: Build a Low-Cost Firewall with a Bear Put Spread
Given that black swans at the current macro level could take off at any time (such as liquidity crises triggered by refund lawsuits or inflation rebounds due to new tariffs), and the options market's Skew shows that everyone is madly selling Calls to suppress upper space, if we merely act as bearish option buyers (Long Puts) to guard against a crash, the Theta (time value) and Vega (volatility) costs incurred are not cost-effective.
Especially in the current period where VRP (Volatility Risk Premium) is severely negative and the market is experiencing significant fluctuations, once market sentiment suddenly stabilizes, merely buying Puts will face serious volatility double kills (IV Crush).
At this point, the Bear Put Spread is the optimal solution for protecting spot assets and hedging macro risks. It significantly reduces hedging costs while providing downside protection through a 'buy one sell one' combination, and it hedges against potential volatility decline risks.
3.1 Strategy Building Logic (Taking BTC and ETH as Examples)
The core of this strategy is: buy a put option with a higher strike price (to obtain protection) while selling a put option with a lower strike price (to collect premiums to subsidize costs).
BTC Practical Portfolio (Assuming Current Price $67,500):
Buy 1 Put option expiring at the end of March with a strike price of $67,000 (nearly at-the-money, providing immediate protection).
Sell 1 Put option expiring at the end of March with a strike price of $62,000 (out-of-the-money, setting a maximum profit floor and collecting premiums).
ETH Differentiated Portfolio (Assuming Current Price $3,400):
Given that ETH's near-term IV has decreased more significantly and its characteristic as a 'high Beta following asset', in extreme market conditions, its decline is often deeper than BTC.
Buy a Put at $3,400 and sell a Put at $2,900. The strike price difference can be widened to cover its larger potential volatility.
3.2 Scenario Simulation and Return Characteristics
Facing the macro environment filled with policy noise in 2026, let's take a look at how this portfolio performs under different scenarios:
Scenario One: Black Swan Lands, Market Crashes (Price Drops Below Low Strike Price, e.g., BTC < $62,000)
Performance: The strategy achieves maximum profit. Although your spot position incurs losses, the options portfolio's profit reaches its maximum (strike price difference - net premium expenditure), and this substantial cash flow can be used to pick up quality chips at the bottom area of $62,000.
Scenario Two: The Boot Does Not Drop, Market Wide Fluctuations (Price Between $62,000 - $67,000)
Performance: The strategy plays a defensive role. For every $1 drop, the options portfolio earns $1 (after offsetting net premium), achieving absolute lock-in of spot value in this range.
Scenario Three: Tax Refund Releases Liquidity, Market Unexpectedly Rises (Price > $67,000)
Performance: The options portfolio faces maximum losses, but this loss is merely the small net premium you initially paid (cost of buying Puts minus income from selling Puts). Since you hold spot, the substantial rise in the spot price will easily cover this minimal 'insurance premium'.
3.3 Why is Bear Spread preferred over simply buying Puts or Collars at this time?
Hedging Vega Risk: The current VRP is deeply negative. If the tariff storm calms down, both realized volatility (RV) and implied volatility (IV) will fall, and merely holding a Long Put will incur significant losses due to the drop in volatility. In a Bear Spread, the leg of the Put you sold will gain profits from the IV decline, offsetting most of the negative impact from Vega.
Capital utilization is extremely high: Selling out-of-the-money Puts collects premiums, significantly lowering your opening costs. Compared to the Collar strategy that requires selling Calls to finance, the Bear Spread completely retains unlimited profit potential from spot price increases. Under the macro expectation that 'tax refunds may equivalently release liquidity', retaining upside exposure is crucial.
4. Disclaimer
This report is based on publicly available market data and options theoretical models, aiming to provide investors with market information and professional analytical perspectives. All content is for reference and communication purposes only and does not constitute any form of investment advice. Cryptocurrency and options trading are highly volatile and risky, which may lead to the total loss of principal. Before adopting any trading strategy, investors should fully understand the characteristics, risk attributes of options products, and their own risk tolerance, and must consult a professional financial advisor. The analysts of this report do not bear any responsibility for any direct or indirect losses arising from the use of this report's content. Past market performance does not predict future results; please make rational decisions.
Co-produced by: Sober Options Studio × Derive.XYZ