
I know an old predecessor who invested 100,000 in the cryptocurrency circle and now has a market value of 42 million. He once told me something that enlightened me. He said: 'In this cryptocurrency market, everyone is a mob; you just need to control your emotions, and this market will be an ATM!'
In the cryptocurrency circle, the trading strategy is your 'secret weapon.' The following phrases are the culmination of practical experience, so hurry and save them!
Entry Section: Test the waters in the cryptocurrency circle, prepare to proceed; enter steadily, refuse to rush.
Consolidation Section: Low-level consolidation creates new lows; heavy positions for bottom fishing are timely; high-level consolidation rises again; decisively sell without hesitation.
Fluctuation Section: Sell on peaks, buy quickly on dips; observe during consolidation, reduce trading. Consolidation means holding tight, and a rise may be just a second away; during rapid rises, be alert for sharp drops, ready to secure profits; during slow declines, it is a good time for gradual averaging.
Timing Section: Don't chase highs, don't sell; don't dive, don't buy; no trading during consolidation. Buy on bearish candles, sell on bullish candles, reverse operations to stand out. Buy when there is a big drop in the morning, sell when there is a big rise in the morning; don't chase highs in the afternoon if there's a big rise, buy the next day if there's a big drop in the afternoon; don't panic-sell if there's a big drop in the morning, don't rise or fall, and take a break; average down to seek to break even; excessive greed is not advisable.
Risk Awareness Section: Calm lake can rise high waves, followed by big tides; after a big rise, there must be a pullback, and the K-line presents a triangle over several days. In an uptrend, look for support; in a downtrend, look for resistance. Over-leveraging is a big taboo, and acting on impulse is not feasible; knowing when to stop in the face of uncertainty and seizing opportunities for entry and exit is crucial.
Trading cryptocurrency is essentially about managing mindset; greed and fear are the main enemies; chasing highs and cutting losses requires caution, maintaining a calm demeanor is key.
In addition to phrases, I have also organized several super practical trading methods that can benefit both novice beginners and experienced players.
Fluctuation Trading Method: Most markets are in a fluctuating pattern; utilizing high selling and low buying within the range is the foundation for stable profit. With the help of the BOLL indicator.
And box theory, combining technical indicators and chart patterns to accurately identify resistance and support. Follow short-term trading principles, and beware of greed.
Breakout trading method after consolidation*: After a long period of consolidation, the market will choose a direction. Entering after the breakout can yield quick profits. However, accurate breakout recognition is required.
Unilateral Trend Trading Method*: After the market breaks through the consolidation, a unilateral trend will form, and following the trend is key to profit. Entering trades during pullbacks or rebounds, referencing K-lines, moving averages, BOLL, trend lines, and other indicators, requires skillful application to navigate smoothly.
Resistance Support Trading Method*: When the market encounters key resistance and support levels, it often gets blocked or supported, and entering a trade at this time is a common strategy.
Use trend lines, moving averages, Bollinger Bands, parabolic indicators, etc., to accurately determine resistance and support levels.
Pullback rebound trading method: After significant rises or falls, a brief pullback or rebound will occur; seize the opportunity to profit easily. The main basis for judging is the K-line shape, and good market feel can help you accurately grasp highs and lows.
Time Period Trading Method: Morning and afternoon sessions exhibit small fluctuations, suitable for conservative investors. Although the time to profit is long, it is easy to grasp the market; evening and early morning sessions show large fluctuations, suitable for aggressive investors, enabling quick profits but with high difficulty, requiring strict technical and judgment capabilities.
You will surely gain something from it, helping others is like helping yourself. I hope that regardless of how the market changes, we can always walk together, and ten years later, we can still smile at the cryptocurrency circle.

Trend follower's secret technique: Lock in tenfold opportunities in ten years.
Specializing in the wealth code of long-term trends:
Halving cycle layout: 180 days before Bitcoin's halving, pre-allocate BTC, BCH, and other halving coins, holding until 30 days after the halving.
Leading recovery law: When the market's leading coin rises by 200%, prioritize choosing second-tier coins in the same sector with less than 50% increase.
Technical triple verification: Weekly MACD golden cross + daily line breaks the box + hourly line shows a bullish engulfing pattern, forming a golden buying point.
Institutional holding analysis: Glassnode data shows that when large addresses continue to increase their holdings, combined with a surge in on-chain trading volume, it is a signal to start.
Bear market dollar-cost averaging strategy: Invest a fixed 10% of principal each month, choosing blue-chip coins like BTC and ETH, and after 12 months of continuous investment, yields exceed 300%.
Risk Warning: The above strategies need to be adjusted according to real-time market conditions. It is recommended that beginners first verify using a demo account, and the loss for each trade should not exceed 2% of total capital. The market has risks, and investments should be cautious.
You can learn from real trading and see the market's clear direction and strategy. Regardless of the market style, being able to know in advance allows you to better master it!!!
1. Introduction
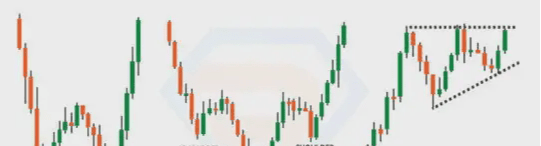
At this stage, you may have already mastered knowledge of many chart patterns, such as the double bottom pattern, ascending triangle structure, and reverse head and shoulders patterns, as shown in the figure below.
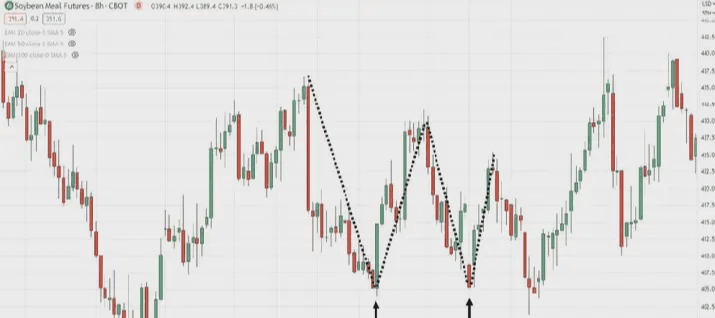
However, as you understand, not all chart patterns will always perform consistently. In this case, when these chart patterns fail to achieve the expected effect, what measures should you take? As shown in the figure below.
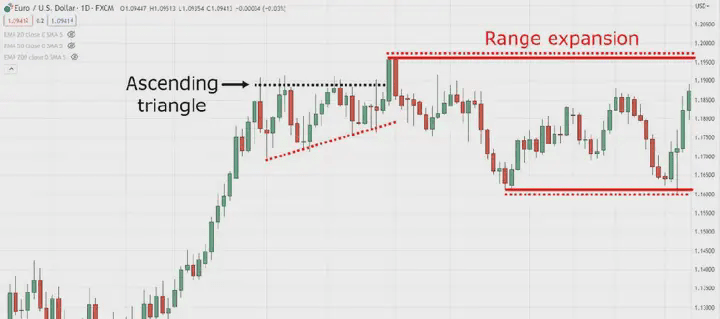
When the scope involved expands further, how will you take action? As shown in the figure below.
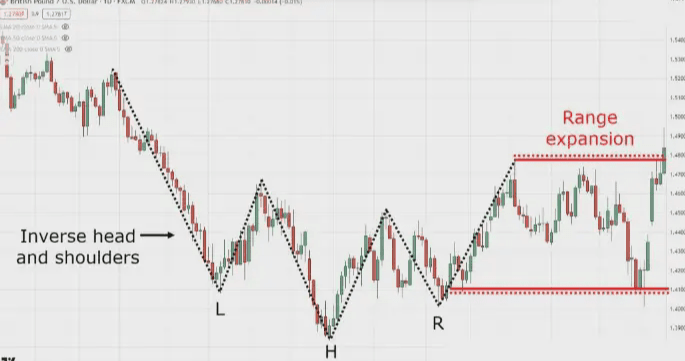
At that time, what kind of trading activities do you plan to engage in on the market? As shown in the figure below.
It is precisely at this moment that the triple bottom pattern shows its unique application value, as shown in the figure below.
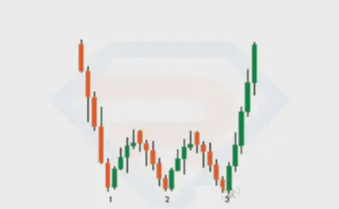
The triple bottom pattern is one of the rarer chart patterns in the current market; however, in the case of market volatility, it remains an indispensable tool in traders' toolbox.
In this guide, you will learn the following:
(1) A detailed guide on how the triple bottom pattern works;
(2) How to avoid misjudging the triple bottom pattern (and the appropriate measures to take in this situation);
(3) Correct trading and analysis methods for the triple bottom pattern;
(4) A step-by-step procedure on how to accurately define and execute triple bottom trades.
2. What is the triple bottom and the truth about how it works.
The triple bottom pattern is like a talented superstar, stepping onto the market stage with its unique talent. It begins at the neckline, and this pattern is the support of the entire structure, as shown in the figure below.
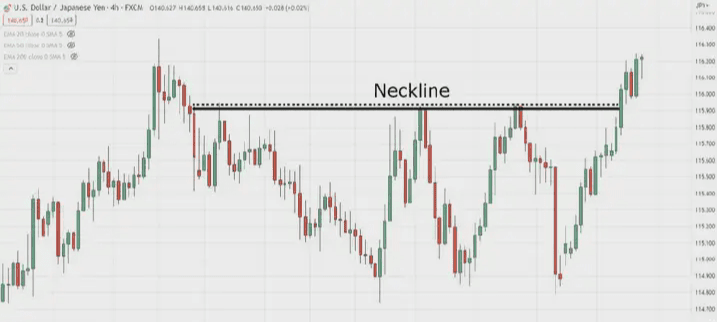
Subsequently, in the dazzlingly complex performances presented by the market, three bottoms appear sequentially, each playing an indispensable role in this captivating pattern, as shown in the figure below.
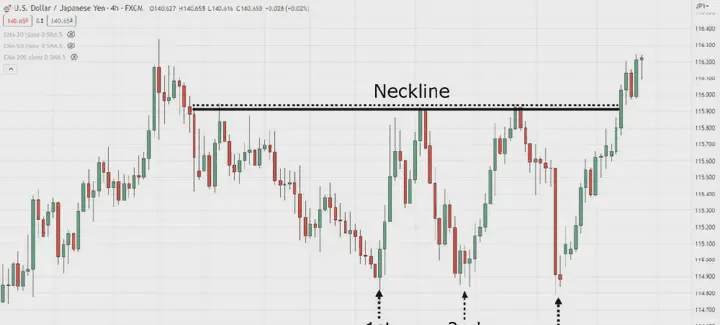
This is like a carefully choreographed synchronized dance, becoming the focal point due to its eye-catching nature, laying the foundation for potential trading opportunities. The pattern is indeed easy to identify.
Now that you understand the appearance of this pattern, how is the triple bottom pattern formed? If you are pondering this question, you are moving in the right direction because understanding 'why' it happens is often more critical than merely knowing 'what' happens.
In this guide, we mainly explore the following three reasons that lead to the formation of the triple bottom pattern.
(1) The market's indecisiveness.
Imagine the market as a capricious individual, its decision-making process indecisive. This is similar to a friend who can never decide where to have dinner or what movie to watch. Thus, the triple bottom pattern emerges, originating from the instability caused by market indecision, as shown in the figure below.
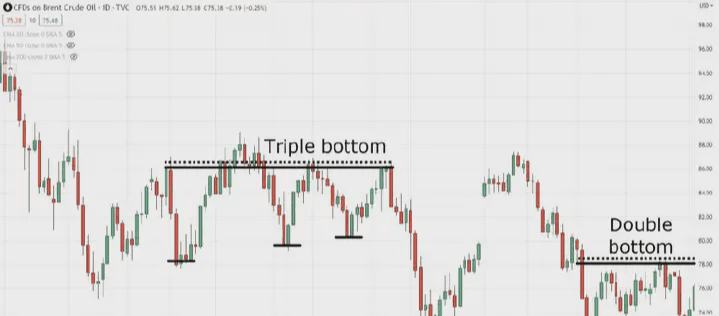
Just as the market seems to say: I can't decide which path to take, did you notice how the price range continuously expanded in the previous example? It's like a paused moment of confusion; however, it provides traders like us with the opportunity to take advantage of the impending market decision. Therefore, essentially, we are discussing that the triple bottom pattern is a direct product of market indecision.
(2) Development takes some time.
This pattern tends to develop gradually with its unique rhythm; however, this only makes it akin to a carefully slow-cooked delicacy, the waiting process is worth it, just like watching a suspense movie where well-informed viewers can anticipate the climax of the plot. The market tests your patience, teasing you with its delicate fluctuations. For those willing to wait patiently and observe carefully, the triple bottom pattern offers a potential opportunity for significant profits. Therefore, remain calm and let this pattern reveal its enticing trading opportunities at the right time. In fact, to further illustrate this principle, you can effectively utilize the triple bottom pattern under the following circumstances.
(3) You missed the double bottom pattern.
If you missed the double bottom pattern, as shown in the figure below.
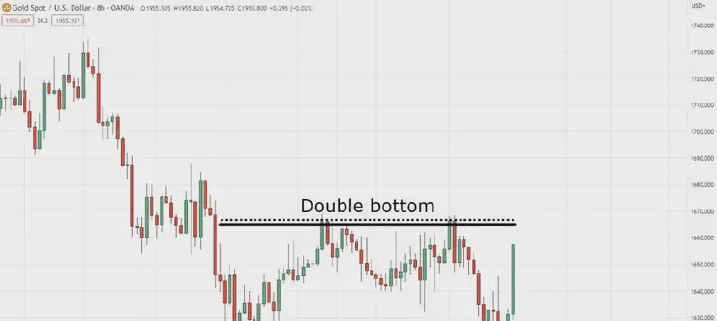
You don't need to toss and turn in regret, because the triple bottom pattern can turn the situation around at this moment, bringing you another opportunity to participate in the market, as shown in the figure below.
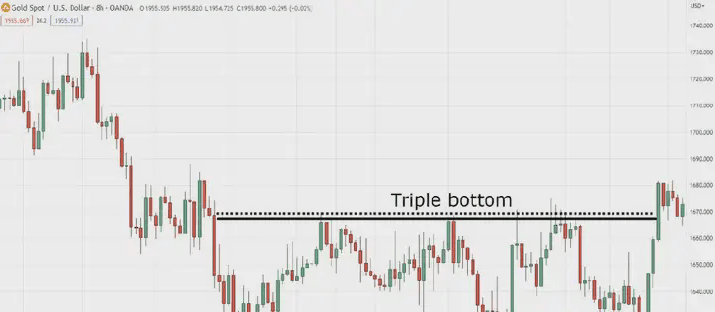
It's like unexpectedly discovering a hidden treasure chest in despair, thinking all hope was lost; this pattern thus provides an additional entry opportunity.
Now, I understand that trading the double bottom pattern may seem more attractive, but the key is whether you can seize the opportunity. For cautious traders seeking more confirmation, closely monitoring the triple bottom pattern is worthwhile; it is a pattern that can bring redemption, excitement, and substantial profits, adding value to your trading chart. Since you have already understood the appearance and operational mechanism of the triple bottom pattern, next, I will explain the situations in which you should not trade this pattern. Remember, all trading patterns have their own advantages and limitations.
3. The biggest mistake when trading the triple bottom: avoid these traps.
(1) Error 1: Trading in the middle of the triple bottom pattern.
First, trading within the price range is like trying to wear a pair of overly tight jeans; discomfort is inevitable. Remember that the triple bottom pattern usually forms during periods of market indecision, and market behavior is similar to a child hesitating in a candy store facing many tempting choices. Therefore, resist the impulse to frequently enter and exit trades during the pattern formation process; instead, patiently wait for the market to make a clear decision.
In summary, avoid trading during the intermediate stages of the pattern establishment process, as shown in the figure below.
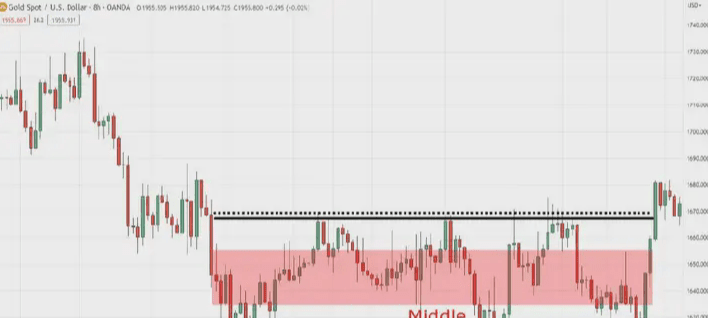
Please focus your attention on the value area, also known as support levels and resistance levels, as shown in the figure below.
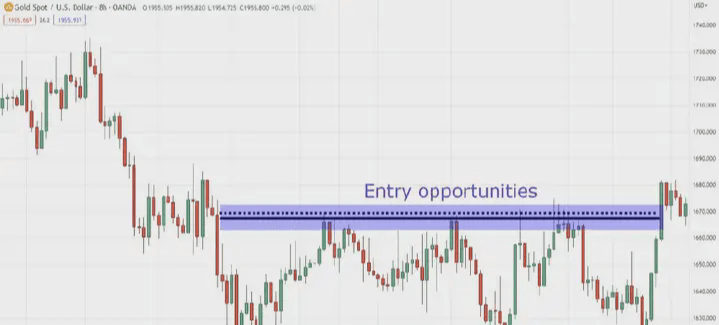
(2) Error 2: Blindly trading highs and lows.
What does this mean? Shouldn't we avoid trading in the middle part of the triple bottom pattern process, even avoiding trading at the high and low points? You should know that the triple bottom pattern is famous for its frequent false breakouts, as shown in the figure below.
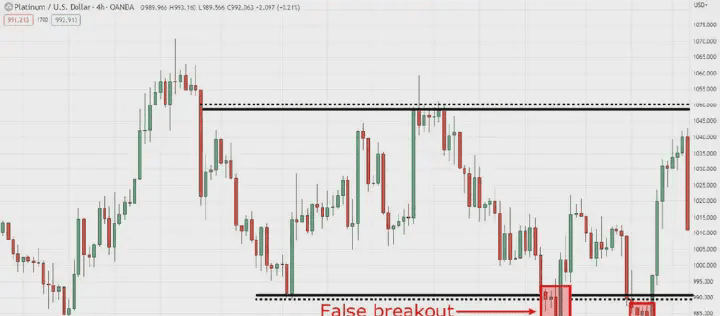
This is due to the inherent characteristics of range markets, which expand and contract. The triple bottom may even evolve into a quadruple bottom, like a prankster lurking in the shadows, ready to jump out and give you a scare. Therefore, do not blindly chase the peaks and troughs of prices like an ignorant squirrel; instead, you should wait for market confirmation before trading, meaning you should patiently wait for the actual breakout to occur after the third bottom, as shown in the figure below.
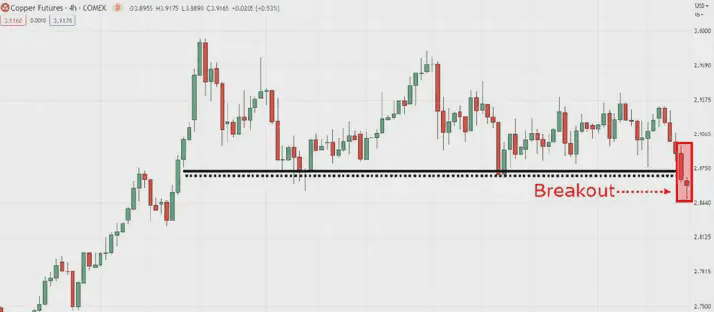
And you should confirm entering this range at the price close, serving as an effective confirmation of the formation of the third bottom, as shown in the figure below.
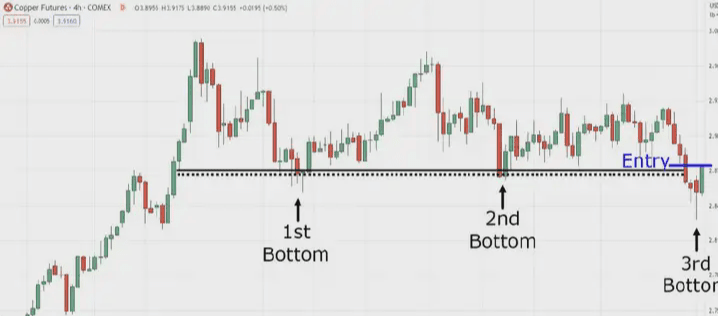
Thus, reaching high and low points does not constitute sufficient reason for immediate trading; instead, you should remain vigilant and wait for the necessary additional confirmation signals.
(3) Error 3: Using the double bottom pattern to judge market direction.
Now, let us clarify one point to correct a common misunderstanding. While the triple bottom pattern may play a key role in the market, it does not possess the prophetic ability to predict market direction. This means that even if you identify the triple bottom pattern, the market has no obligation to break out to higher levels, as the following situations may also occur, as shown in the figure below.
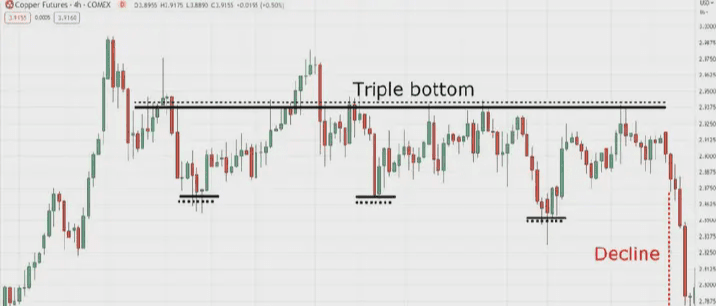
This is akin to expecting to predict tomorrow's lottery numbers through a crystal ball, which is almost impossible. Therefore, do not rely solely on the triple bottom pattern to determine the future trend of the market; instead, analyze other related factors comprehensively and view the triple bottom pattern as one of the auxiliary tools, rather than the sole decision-making indicator.
(4) Error 4: Over-reliance on 'textbook-style' triple bottoms.
When discussing the triple bottom pattern, do not cling too tightly to the definitions in traditional textbooks, as shown in the figure below.
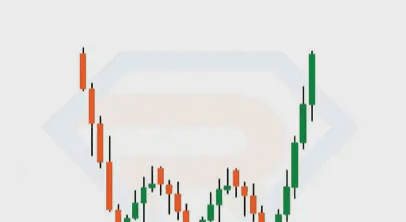
This pattern is like a chameleon, its shape varies greatly, and every turn brings new surprises, indicating the existence of multiple effective triple bottom variants, as you have observed previously, as shown in the figure below.
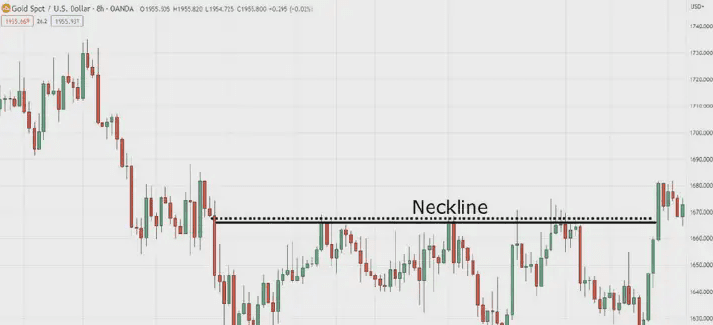
And this, as shown in the figure below.
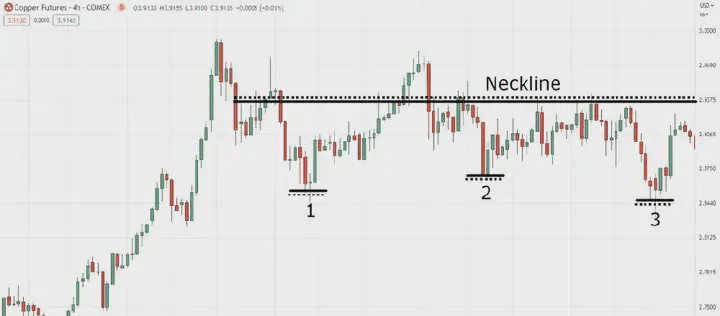
Therefore, put down your rigid expectations of the pattern and appreciate the beauty of its morphological diversity. The key lies in those 'sharp bottoms' that you identify on the chart.
Now, you may be thinking: I know how to identify this pattern and the behaviors I should avoid when trading; how should I trade? If this is your question, now is the time to showcase your trading skills because I will reveal to you three key market movements to focus on when trading the triple bottom pattern.
4. The ideal strategy for achieving success in trading the triple bottom pattern.
(1) Ensure that the triple bottom is within the existing upward trend.
By ensuring that your trading actions are in sync with the current market uptrend, as shown in the figure below.
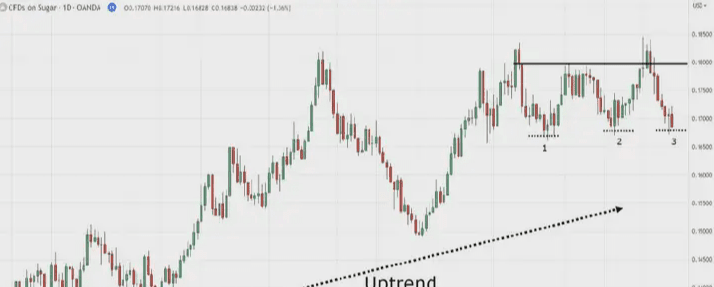
You are enhancing the probability of trading success and following the market's rhythm, paying attention to this upward trend, just like an experienced dancer seeking an ideal partner, ready to elegantly rotate and immerse in the unfolding of the triple bottom pattern.
(2) Look for false breakouts or accumulation.
When you observe a false breakout at the third bottom, as shown in the figure below.
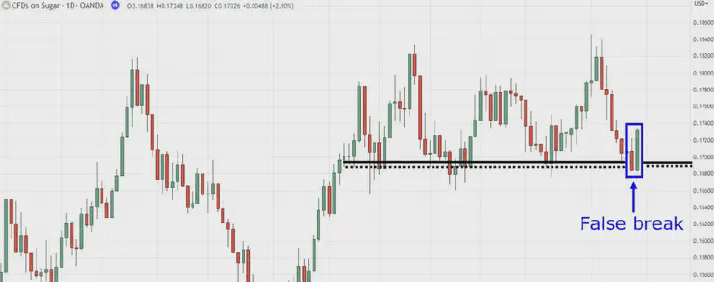
This is like noticing your dance partner pretending to be tired on the dance floor but then quickly revitalizing with their talent, indicating a signal that the pattern is ready to take the spotlight in the market, as shown in the figure below.
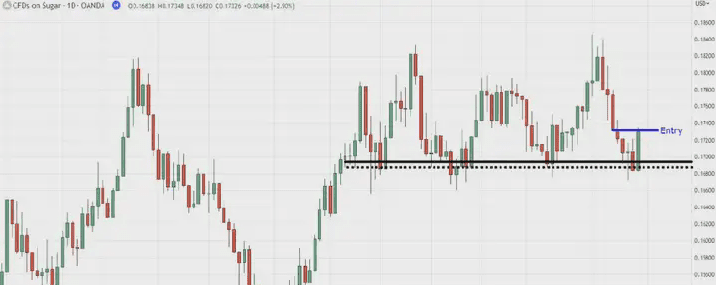
From another perspective, if you encounter the following situations: failing to grasp the entry timing for the double bottom pattern or missing the false breakout trading opportunity for the triple bottom pattern, do not worry, because there are still opportunities waiting for you. This is because if you observe price accumulation at high points, as shown in the figure below.
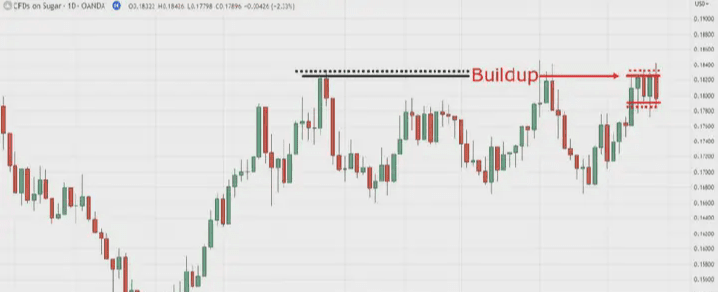
This is like witnessing the moment just before the electrified elevator starts, as this phenomenon indicates that the triple bottom pattern is preparing for a potential energy-rich breakout, as shown in the figure below.
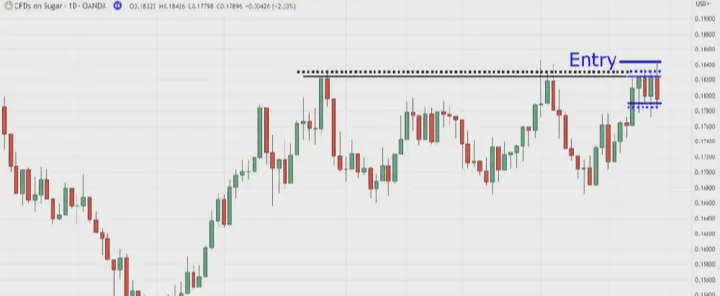
Therefore, please keep an eye on these cutting-edge market movements and be ready to showcase your trading abilities on the market stage. At this stage, you have mastered all the necessary key elements to successfully execute trading on the triple bottom pattern. However, as you well know, the effectiveness of the tools you have mastered depends on how you apply them. If you have been trading similar double bottom patterns for a long time, you are more than prepared. However, if you seek a concise guide to understand how to utilize the triple bottom pattern for market discovery, trading, and trade management, then please continue reading the following content of this guide.
5. Master the triple bottom: a trading strategy that lets you dance in profits.
(1) Step 1: First determine the upward trend within the daily time frame.
Consider it as discovering the ideal rhythm, laying the foundation for a captivating performance, exploring those continuously rising highs and lows, which symbolize a strong upward trend, as shown in the figure below.
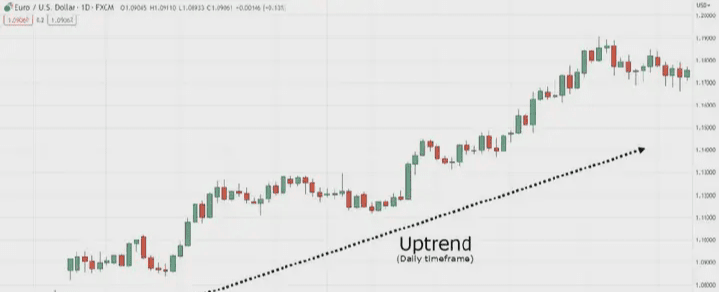
Once you confirm this upward trend, you move on to the next stage, closely following the market's rhythm.
(2) Step 2: Identify potential triple bottoms in the 4-hour time frame.
At this moment, shift your observational focus to the 4-hour chart, where the potential triple bottom pattern will appear vivid and clear. Compare this process to dance choreography, where each step carries a specific goal. Identify the triple bottom pattern, which is formed by three different bottoms connected by the neckline, as shown in the figure below.
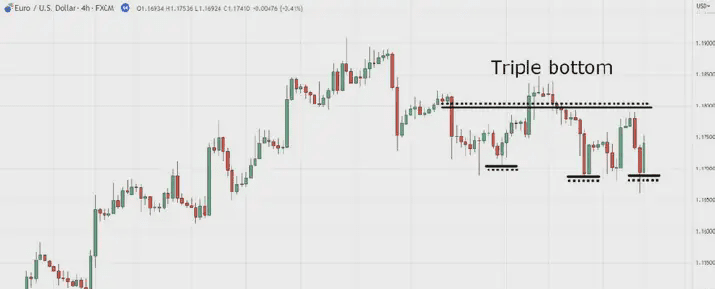
It's like observing a group of dancers synchronizing their steps, weaving eye-catching patterns on the dance floor. Once you identify this masterpiece of the triple bottom pattern, you should begin preparing for precise trading entry.
(3) Step 3: Trading at three points of false breakouts.
This is similar to executing a stunning spinning move or quickly changing direction on the dance floor, leaving all observers in admiration. When the market briefly dips below the third bottom and then quickly rebounds, as shown in the figure below.
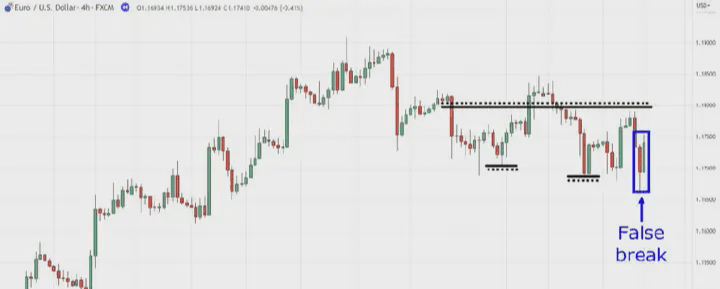
This is a sign indicating that the pattern is ready to take off, preparing to become the focal point of the market. Therefore, please, like an experienced dancer, follow this momentum into trading and showcase your trading skills, seizing the market opportunity, as shown in the figure below.
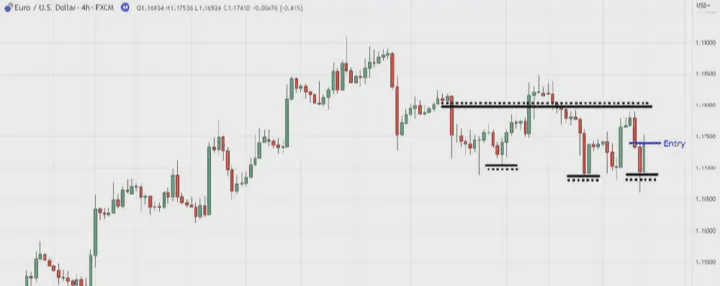
Timing is crucial; patiently wait for that false breakout to occur and take swift action.
(4) Step 4: Accumulation on the neckline reduces the scale.
At this moment, it is time to enhance your trading performance. You may wonder: how to achieve this? By gradually reducing the trading scale near the neckline, as shown in the figure below.
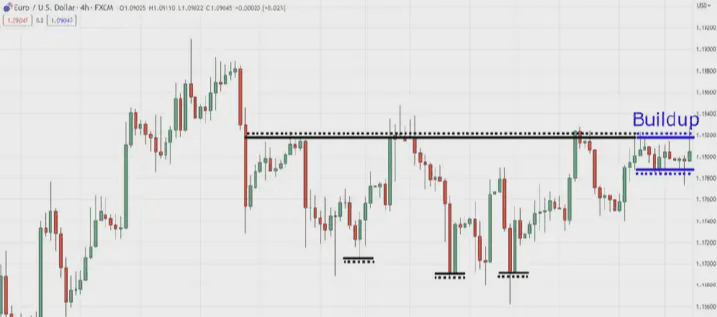
Consider it a grand upgrade in a dance choreography, where energy surges to a new peak. When the price decisively crosses the neckline, it signifies that the triple bottom pattern is about to unleash its full market potential. In this situation, how should you act? Simply put, you should increase your position size, expanding on the basis of the initial trade to maximize your profit potential, as shown in the figure below.
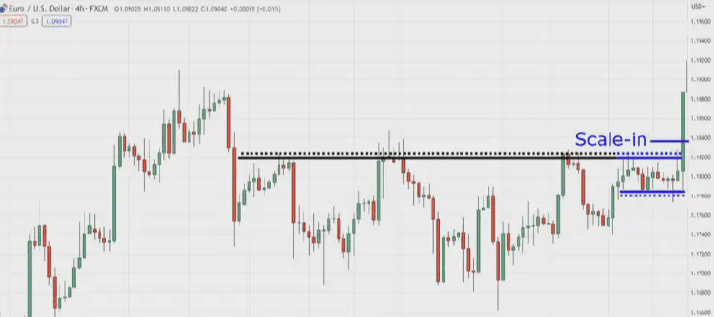
This is akin to the crescendo in a musical piece, the key is that this breakout provides investors with an opportunity to ride the wave of victory.
(5) Step 5: Use the 20-period moving average for trailing stop.
Since you have delved into this field, how should you manage it? In this case, I suggest using the 20-period moving average as a trailing stop tool, as shown in the figure below.
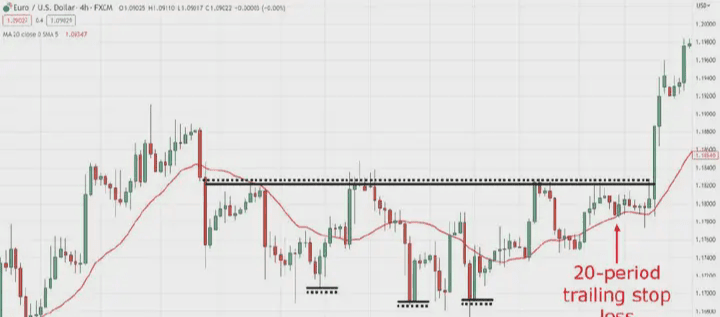
This indicator is like a trustworthy partner in dance, ensuring your safety on the trading stage. As prices change in your favor, use this dynamic indicator to adjust your stop-loss position to protect your profits, as shown in the figure below.
Here are other points you should understand. You always have the right to choose between stage 3 and stage 4. For traders who tend to take on higher risks, you can choose to trade between stages 3 and 4; if you are a more conservative trader, you can choose to enter the market when the price breaks the neckline (i.e., stage 4); if your trading style falls between the two, you can consider taking action in stage 3 without reducing your position, but rather expanding horizontally in stage 4.
Therefore, put on your trading 'battle boots,' practice these steps, and let this simple triple bottom strategy be your ticket to trading success.
6. Conclusion
The following is an overview of the core points of this guide:
(1) The triple bottom pattern provides a second entry opportunity for traders who failed to grasp the double bottom opportunity.
(2) It consists of a neckline and three different bottoms, usually forming during periods of market indecision and requiring some time to develop.
(3) When trading the triple bottom, avoid common mistakes, such as trading within price ranges and relying too much on textbook patterns.
(4) The best trading method is to align with the existing upward trend in the market and focus on false breakouts at lows or price accumulation at highs.
(5) A simple trading strategy includes identifying upward trends, discovering triple bottom patterns, trading false breakouts, adjusting position sizes during breakouts, and using the 50-period moving average as a trailing stop tool.

Simple and practical cryptocurrency trading tips that help you earn steadily.
1. Gradual investment: Suppose you have 10,000 yuan, divide it into five parts, and only use 2,000 yuan for each trade.
2. Test investment: First use 2000 yuan to buy a coin and test the waters.
3. Add more positions after a drop: If the coin price drops by 10%, add 2000 yuan.
4. Sell to lock in profits: If the coin price rises by 10%, promptly sell part to secure profits.
5. Repeated cycles: Continuously buy and sell until funds or coins are exhausted.
Strategy advantages: The benefit of this strategy is that even if the coin price drops, you can remain calm. By entering in batches, you avoid the risk of a one-time investment. Even if the coin price drops by half, you are only gradually increasing your position. Each time you sell, you can lock in a 10% profit. For example, if you have 100,000 yuan, invest 20,000 each time and make 2,000 yuan each time. #美联储降息预期