Good job friend....

Post

--

Memento Mori-Vivere-Amoris
·
--
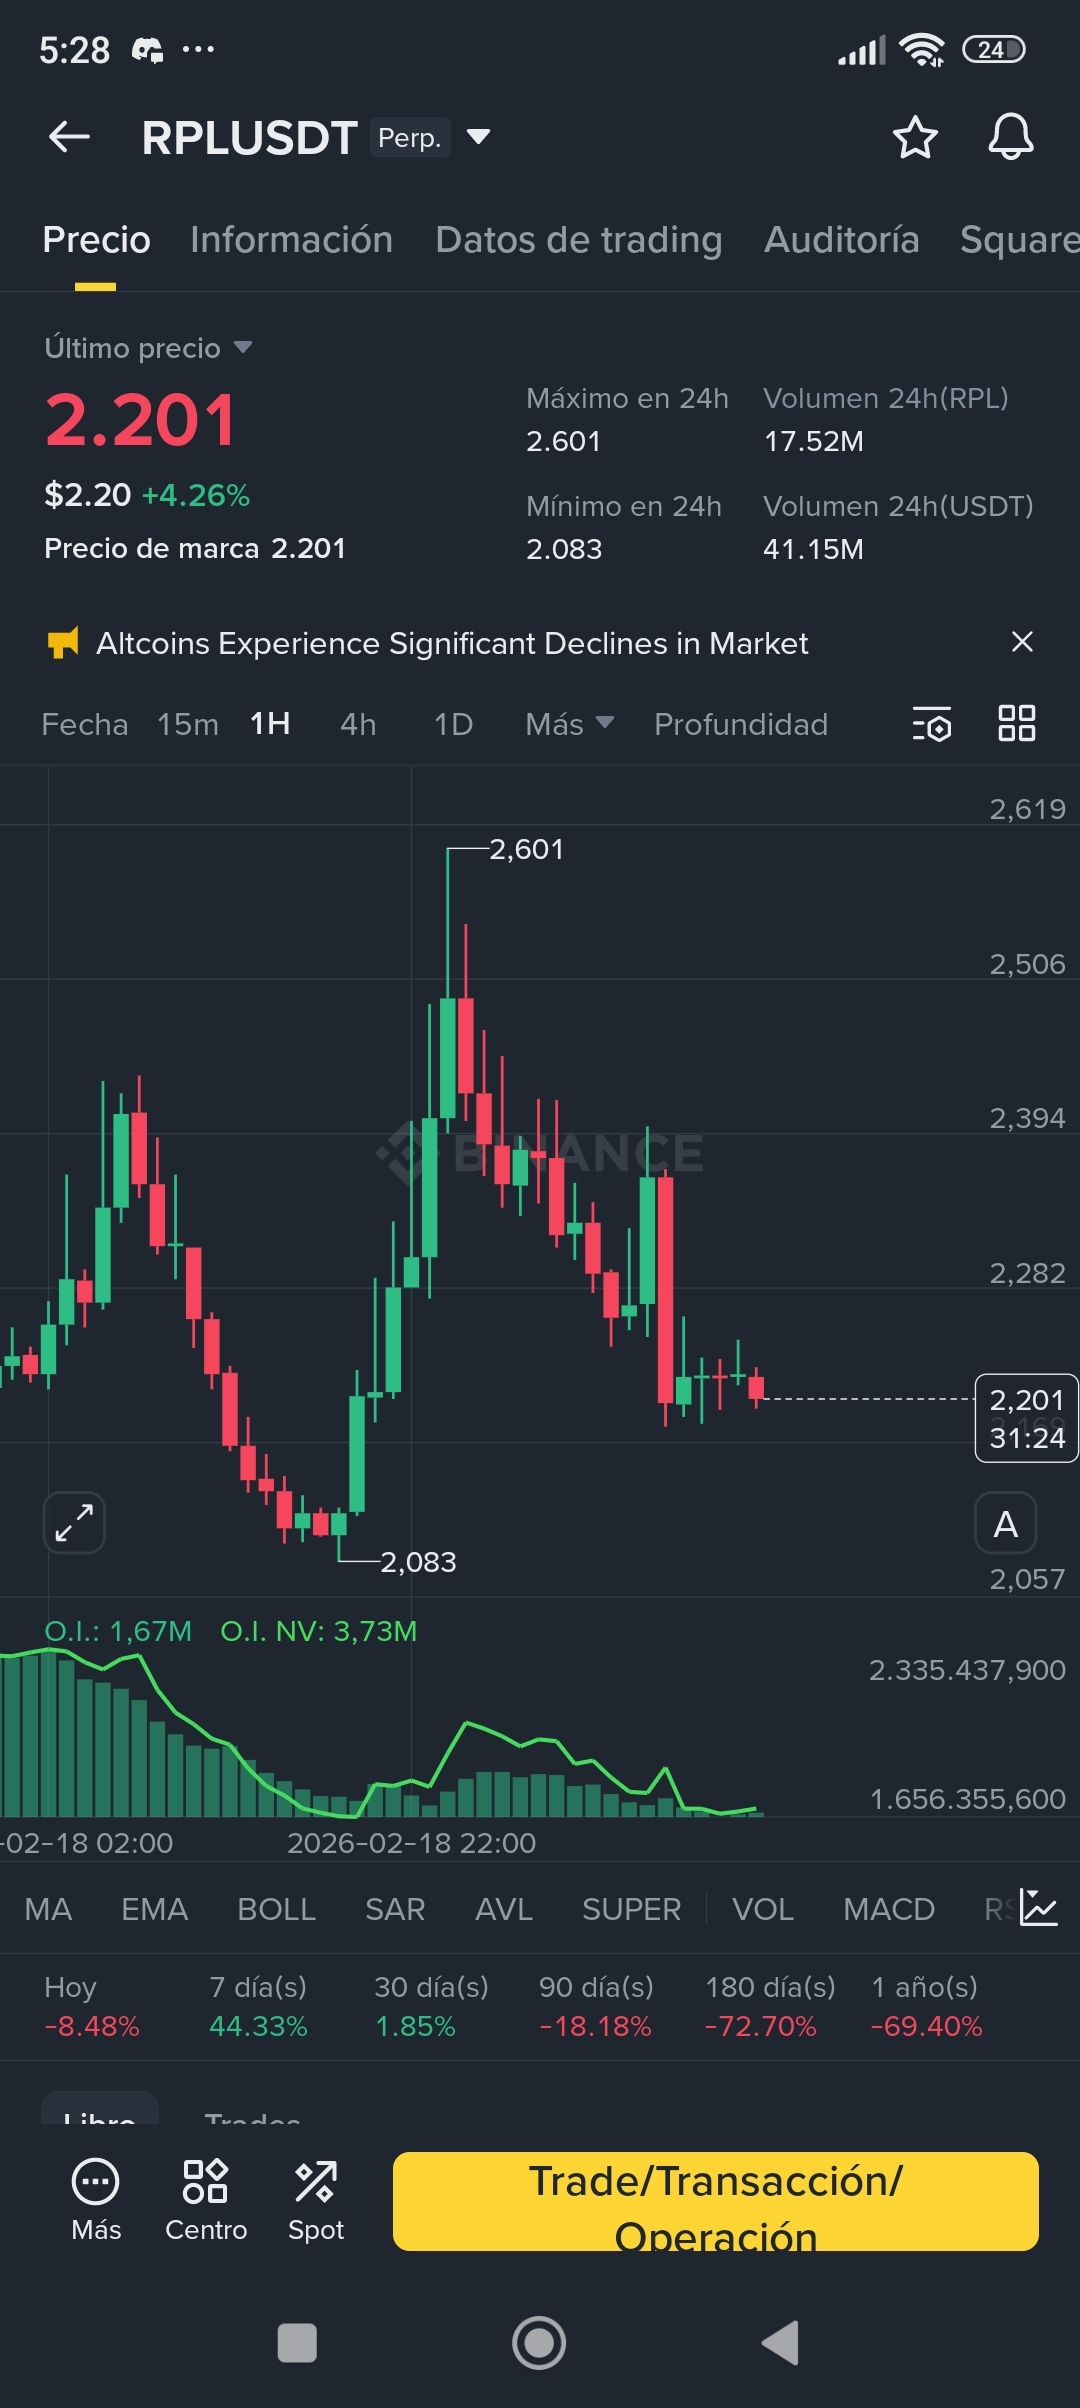
Open Interest is the metric that confirms whether traders are entering with fresh money or if they are exiting with Stop Loss and liquidations.
If O.I. rises, it means new contracts are being created.
If O.I. falls, it means traders are closing positions or that they just liquidated a lot of people.
Its logic is simple: Interest equals Participation. Without interest, price movement is weak.
If we want to take advantage of this indicator we must consider the following:
1. Price rises and O.I. rises: Healthy and strong bullish trend. People are opening long positions to drive it higher.
2. Price falls and O.I. rises: Aggressive bearish trend. Many people are opening shorts.
3. Price moves and O.I. remains flat: It’s a liquidity trap. The movement has no real support. It’s pure noise or profit-taking from Stop Loss and liquidations.
4. Price falls and O.I. also falls: Indicative of Long Liquidation (liquidation of long positions).
5. Price rises and O.I. falls: Indicates Short Covering (passive closure of short positions).
6. Price rises and O.I. falls drastically: This is a Short Squeeze and it’s not just closing shorts, it’s exhaustion. This is where those who know, sell.
Recommended Setup: Use two contrasting colors that won’t burn your eyes so you can quickly identify the direction of the curve.
Advanced reading tips:
1. If you see the price reaching the EMA 200 and O.I. suddenly starts to rise, something big is brewing, get ready.
2. Pay special attention to the direction of the curve: If the O.I. curve is pointing upwards while the price breaks a Bollinger Band, you have a high-level confirmation.
3. O.I. should be looked at alongside the Funding Rate for a better reading:
O.I. rising + high positive Funding = Longs paying to hold. Danger of Long Liquidation.
O.I. rising + high negative Funding = Shorts paying to hold. Danger of Short Squeeze.
$OM
$RPL
$ORCA
If O.I. rises, it means new contracts are being created.
If O.I. falls, it means traders are closing positions or that they just liquidated a lot of people.
Its logic is simple: Interest equals Participation. Without interest, price movement is weak.
If we want to take advantage of this indicator we must consider the following:
1. Price rises and O.I. rises: Healthy and strong bullish trend. People are opening long positions to drive it higher.
2. Price falls and O.I. rises: Aggressive bearish trend. Many people are opening shorts.
3. Price moves and O.I. remains flat: It’s a liquidity trap. The movement has no real support. It’s pure noise or profit-taking from Stop Loss and liquidations.
4. Price falls and O.I. also falls: Indicative of Long Liquidation (liquidation of long positions).
5. Price rises and O.I. falls: Indicates Short Covering (passive closure of short positions).
6. Price rises and O.I. falls drastically: This is a Short Squeeze and it’s not just closing shorts, it’s exhaustion. This is where those who know, sell.
Recommended Setup: Use two contrasting colors that won’t burn your eyes so you can quickly identify the direction of the curve.
Advanced reading tips:
1. If you see the price reaching the EMA 200 and O.I. suddenly starts to rise, something big is brewing, get ready.
2. Pay special attention to the direction of the curve: If the O.I. curve is pointing upwards while the price breaks a Bollinger Band, you have a high-level confirmation.
3. O.I. should be looked at alongside the Funding Rate for a better reading:
O.I. rising + high positive Funding = Longs paying to hold. Danger of Long Liquidation.
O.I. rising + high negative Funding = Shorts paying to hold. Danger of Short Squeeze.
$OM
$RPL
$ORCA