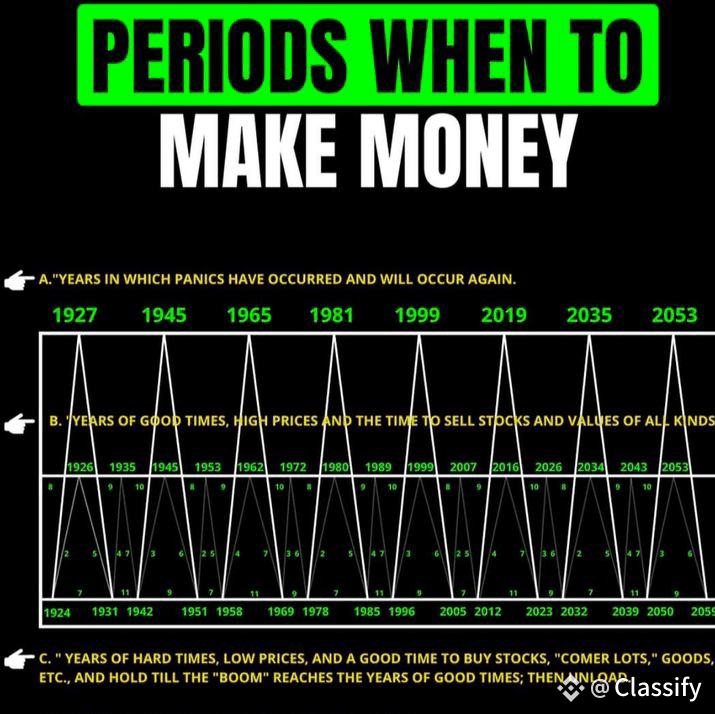
$BTC & BENNER CYCLE (1875) – HISTORY REPEATS?
📈 Bitcoin’s rally is lining up with Samuel Benner’s legendary financial cycle chart. According to it, 2026 = “B” Year → Boom, High Prices, Time to Sell.$BTC
🔹 2023–24 = “C” Years → Accumulation phase (best buying zone)
🔹 2026 = “B” Year → Peak valuations, euphoria zone
🔹 “A” Years = Panic & crashes
Why it matters:
Benner’s 150-year-old model divides markets into cycles of Panic (A), Boom (B), and Accumulation (C).
Supporters say it aligns with Bitcoin’s halving-driven bull runs.
Critics call it outdated, overly simple, and prone to cherry-picking results.
⚡ Lesson: Smart money doesn’t chase hype—they ride the cycles.
👉 Use cycles as a map, not a guarantee. Always combine with real market analysis.
If you found this useful: Like & Share 🚀$BTC
#BinanceHODLerOPEN #USNonFarmPayrollReport #MarketPullback
📈 Bitcoin’s rally is lining up with Samuel Benner’s legendary financial cycle chart. According to it, 2026 = “B” Year → Boom, High Prices, Time to Sell.$BTC
🔹 2023–24 = “C” Years → Accumulation phase (best buying zone)
🔹 2026 = “B” Year → Peak valuations, euphoria zone
🔹 “A” Years = Panic & crashes
Why it matters:
Benner’s 150-year-old model divides markets into cycles of Panic (A), Boom (B), and Accumulation (C).
Supporters say it aligns with Bitcoin’s halving-driven bull runs.
Critics call it outdated, overly simple, and prone to cherry-picking results.
⚡ Lesson: Smart money doesn’t chase hype—they ride the cycles.
👉 Use cycles as a map, not a guarantee. Always combine with real market analysis.
If you found this useful: Like & Share 🚀$BTC
#BinanceHODLerOPEN #USNonFarmPayrollReport #MarketPullback