
$WLFI is currently the center of attention as it records impressive growth over the past 24 hours.
After a series of bottom searches, the Bulls have officially returned, pushing prices out of the danger zone.

🔷 Market Overview
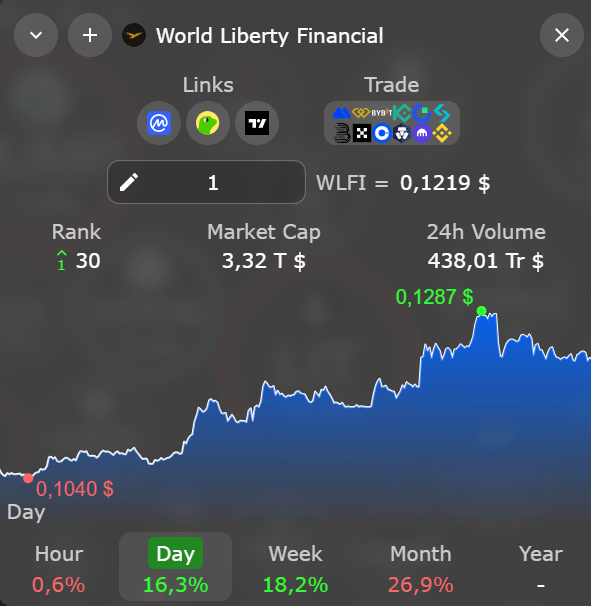
Current price: Around $0.1221.
24h performance: Strong growth +16.3%.
Market cap: Reached $3.32 Billion USD, confirming its position as a major project.
Trading volume: 24h volume reached $438.01 Million USD, indicating a very aggressive influx of capital.
🔶 Market Structure & Price Action
Daily Frame - Confirming the Solid Bottom
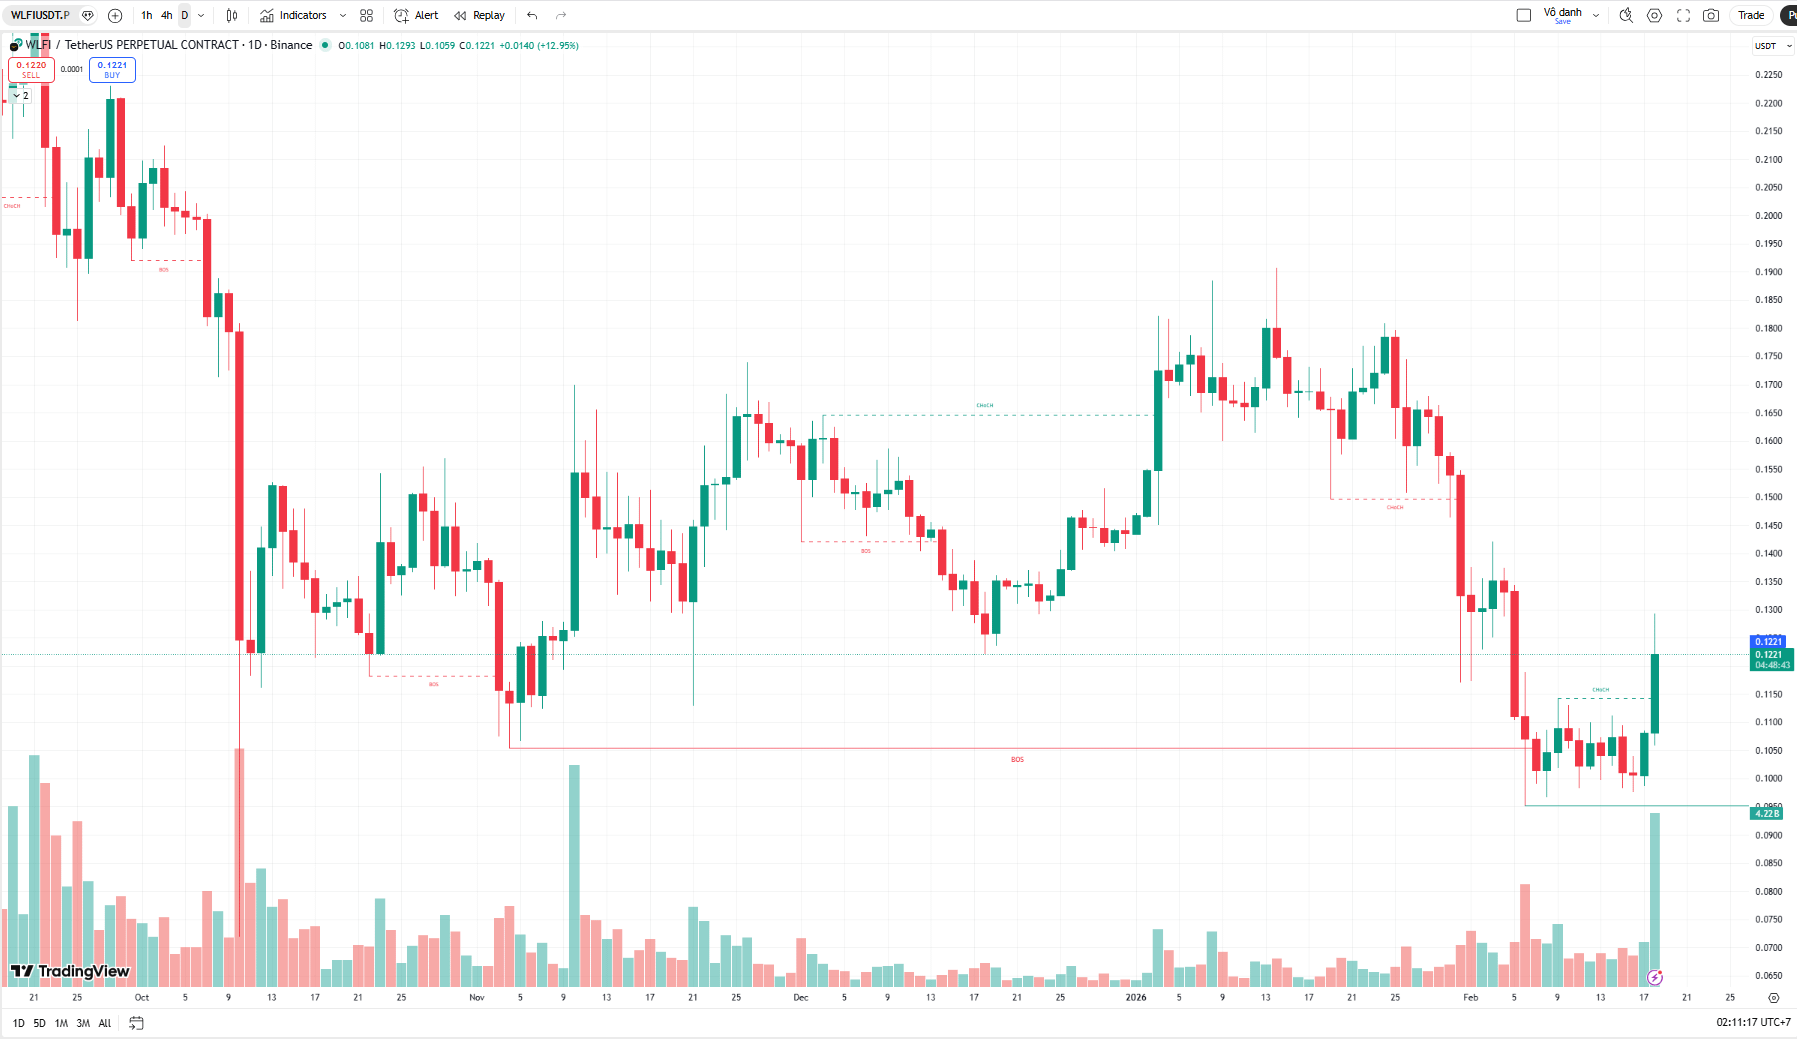
Diamond support zone:
The D1 chart shows that the price has formed a solid bottom around the range of $0.095 - $0.100.
This is the area where the sellers are completely exhausted and the buyers are starting to accumulate heavily.
Powerful bullish candle:
The current daily candle is a Marubozu candle, completely covering the previous bearish candles, accompanied by the highest buying volume spike in many weeks.
This is a confirmation signal that Smart Money has entered.
4H & 1H Frame - Trend Reversal
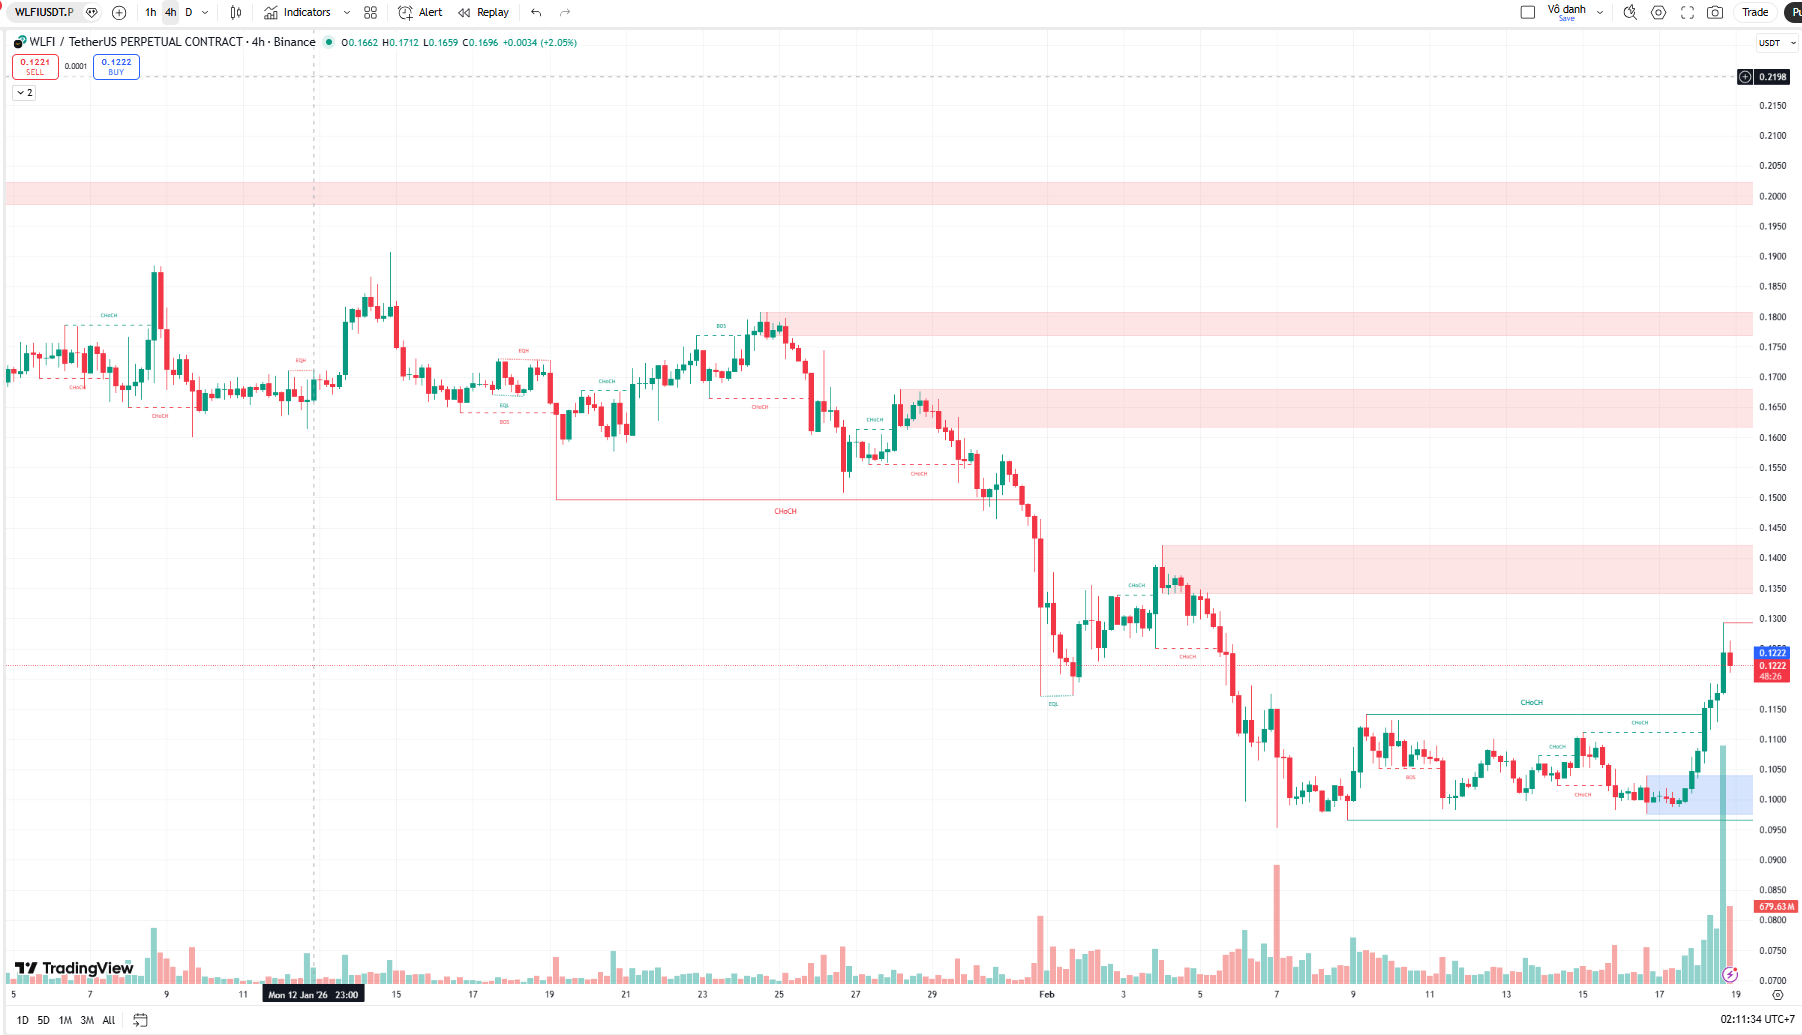
Breaking down the bearish structure:
On the 4H frame, the price has broken previous lower highs to create a change in market characteristics.
The trend has officially shifted from Bearish to Bullish.
Reaccumulation:
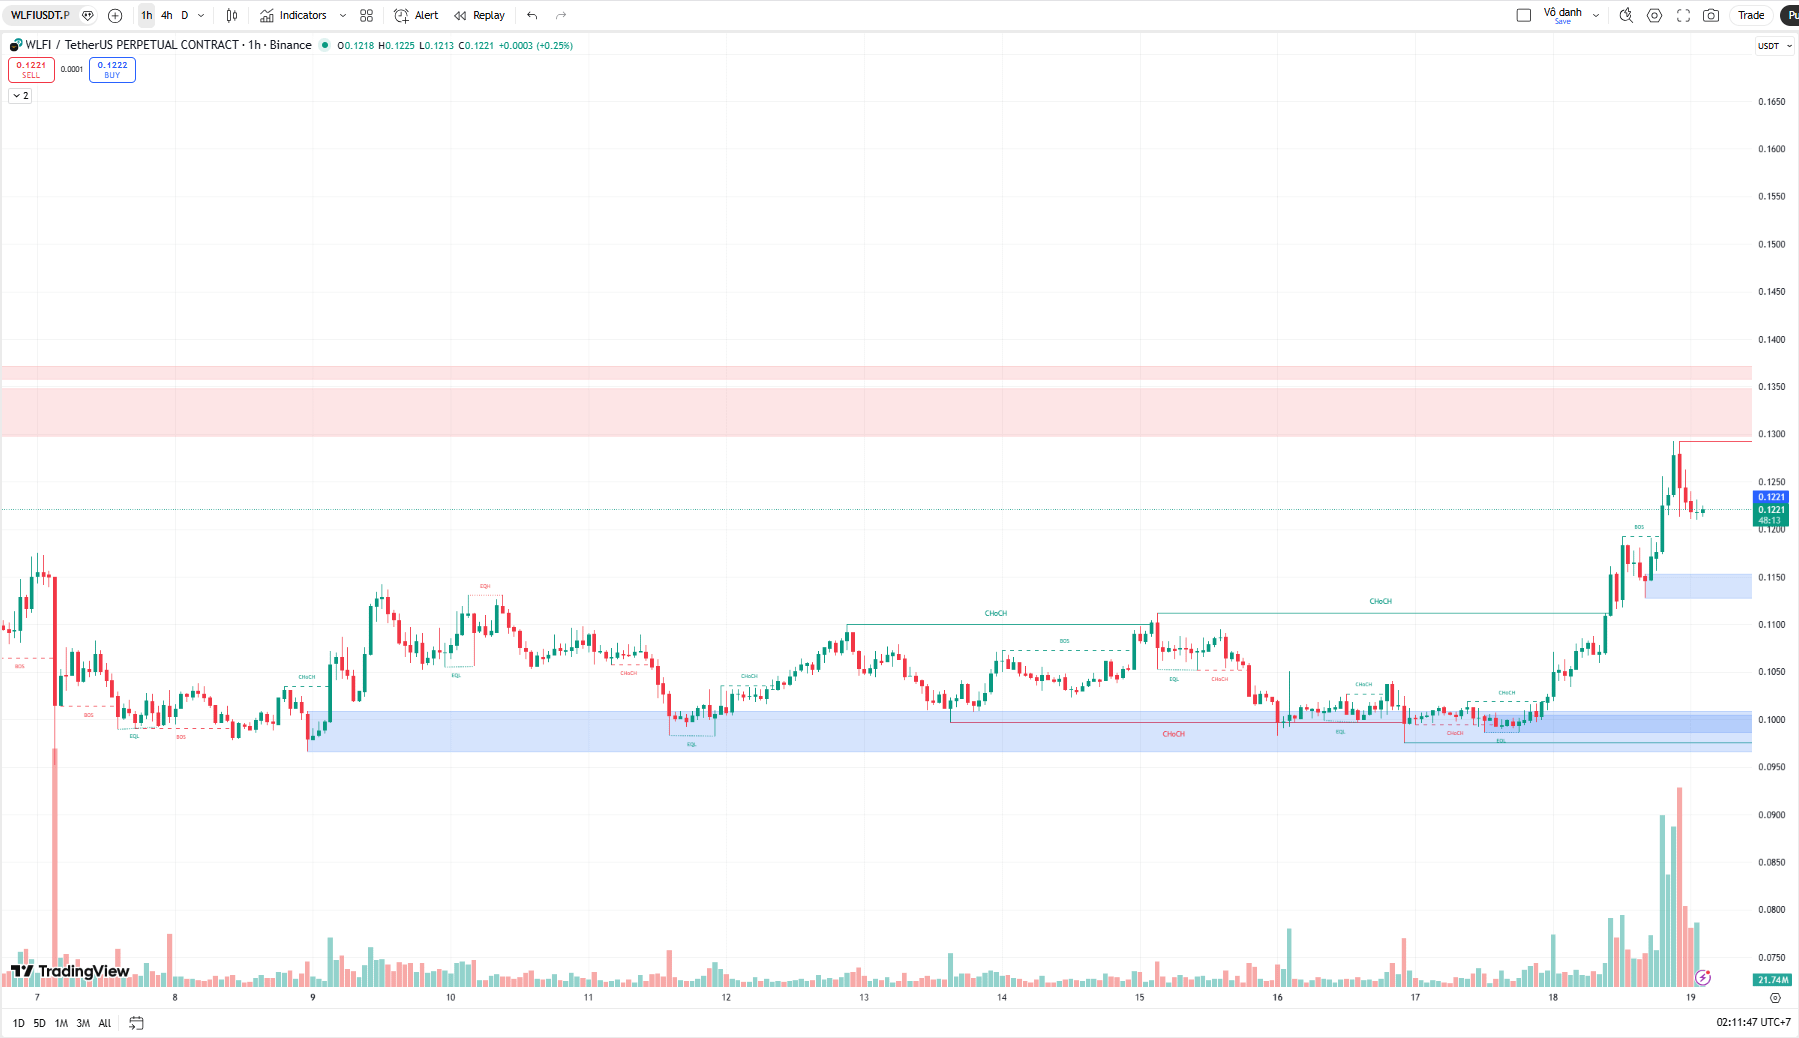
On the 1H frame, after breaking the resistance at $0.115, the price has successfully tested back and continues to rise according to the structure of higher highs.
🔷 Reasons for Price Increase
Whales Accumulating:
On-chain data shows that large whale wallets have withdrawn millions of tokens from Binance, and large Long positions have shifted from losses to profits, creating a bullish sentiment in the community.
Hunting Liquidity:
The heatmap shows that the price is being pulled up by the liquidity zones of the Shorts.
The Market Maker is pushing the price up to sweep the stop-loss orders above.
🔶 Heatmap Analysis: Price Magnet at $0.130
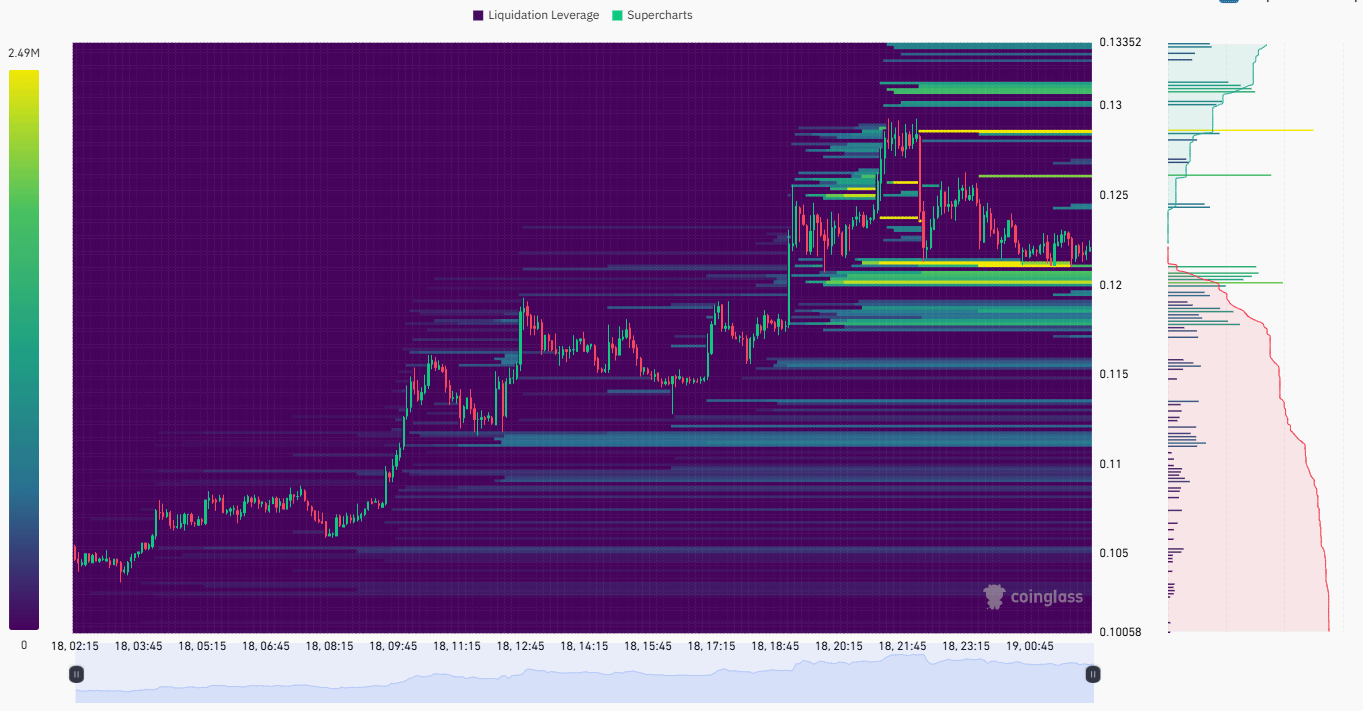
Liquidation Heatmap provides important clues about the upcoming price trajectory:
Target above:
A very thick liquidity band is concentrating at the price range of $0.128 - $0.130.
This is the magnet pulling the price up.
There is a very high possibility that the price will need to touch this area to liquidate the Short positions that are currently at a loss.
Support below:
The range of $0.120 - $0.122 has now formed a layer of liquidity support, preventing the price from dropping further.
🔷 Future Trend Prediction
Based on the current momentum, the dominant trend is UP.
📈 Positive Scenario - Bullish Case
Short-term target: The price will continue to rise to test the liquidity zone of $0.128 - $0.130.
Breakout: If it surpasses $0.130 with high volume, WLFI will expand its upward range to the next resistance zone on the daily chart at $0.145 - $0.150.
📉 Negative Scenario - Bearish Case
Correction: If there is profit-taking pressure at $0.125, the price may return to test the support zone just broken at $0.115.
Danger: Only if the price closes the 4H candle below $0.110, the bullish structure will be broken and the price may return to the pig trough at $0.100.
💡 Trading Recommendation
Position currently held: Continue to HODL and move the stop-loss up to the area of $0.115 to secure profits.
New purchase: Do not FOMO buy at the price of $0.122. Wait for a slight correction to the range of $0.118 - $0.120 for a safer entry.
Take profit: Aim to take partial profits at the heavily liquid range of $0.128 - $0.130.
WLFI has awakened from its slumber. With strong cash flow and a technical reversal structure, the level of $0.130 is within reach.
This article is for reference only and is not investment advice. Please read and consider carefully before making a decision.