


1. Types of trends (Uptrend, Sideways, Downtrend)
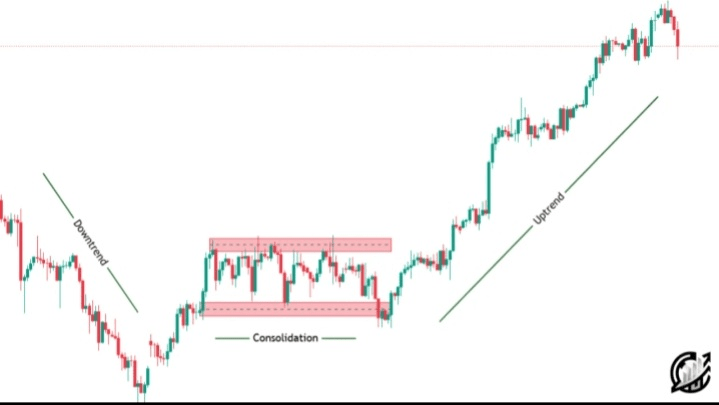
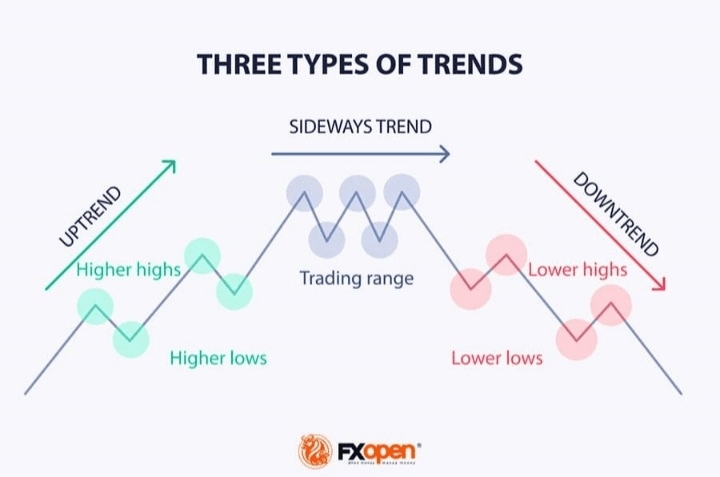
This image clearly displays the three main types of trends and how to visually distinguish them.
2. A graph showing trend lines (Uptrend, Downtrend, Sideways)
Explains how to draw trend lines to accurately determine the overall direction of the market.
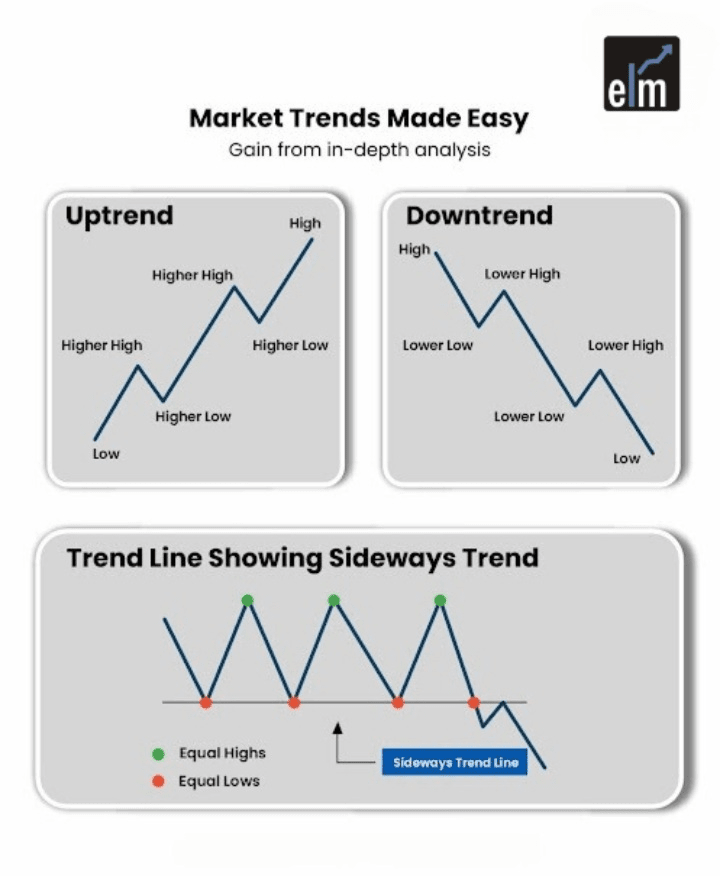
3. Mini examples of Uptrend, Downtrend, Sideways Trends
Provides a simplified visual explanation for each type of trend, making it useful for quick learning.
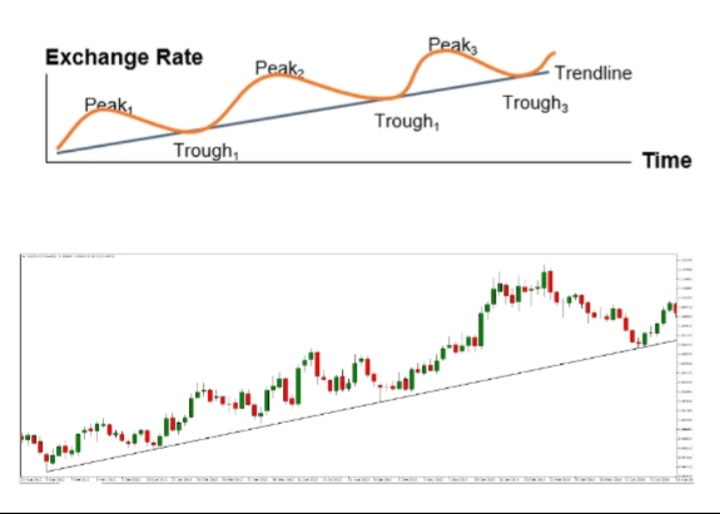
4. Practical example of an uptrend
Shows a real price movement with an upward trend line indicating potential buying opportunities.
---
How do you use these images in trading?
Trend Interpretation How to benefit
Uptrend Continuous rise in prices Use pullbacks to buy and set a stop loss below a previous low.
Downtrend Continuous decline in prices Wait for brief pullbacks to enter sell orders and protect your capital.
Sideways Sideways movement within a defined range Buy at support and sell at resistance, or wait for consolidation before breaking out of the range.
---
Professional tips
Draw trend lines: Connect two consecutive lows in an uptrend or two peaks in a downtrend and extend the line forward to identify entry or exit points.
Use indicators to confirm the trend:
Moving averages (MA) such as EMA/SMA
MACD, RSI
Parabolic SAR to identify reversal points or stop-losses.
Monitor volatility: In sideways trends, indicators like Bollinger Bands can help determine when to break out of the range.$XRP $BNB $BTC #