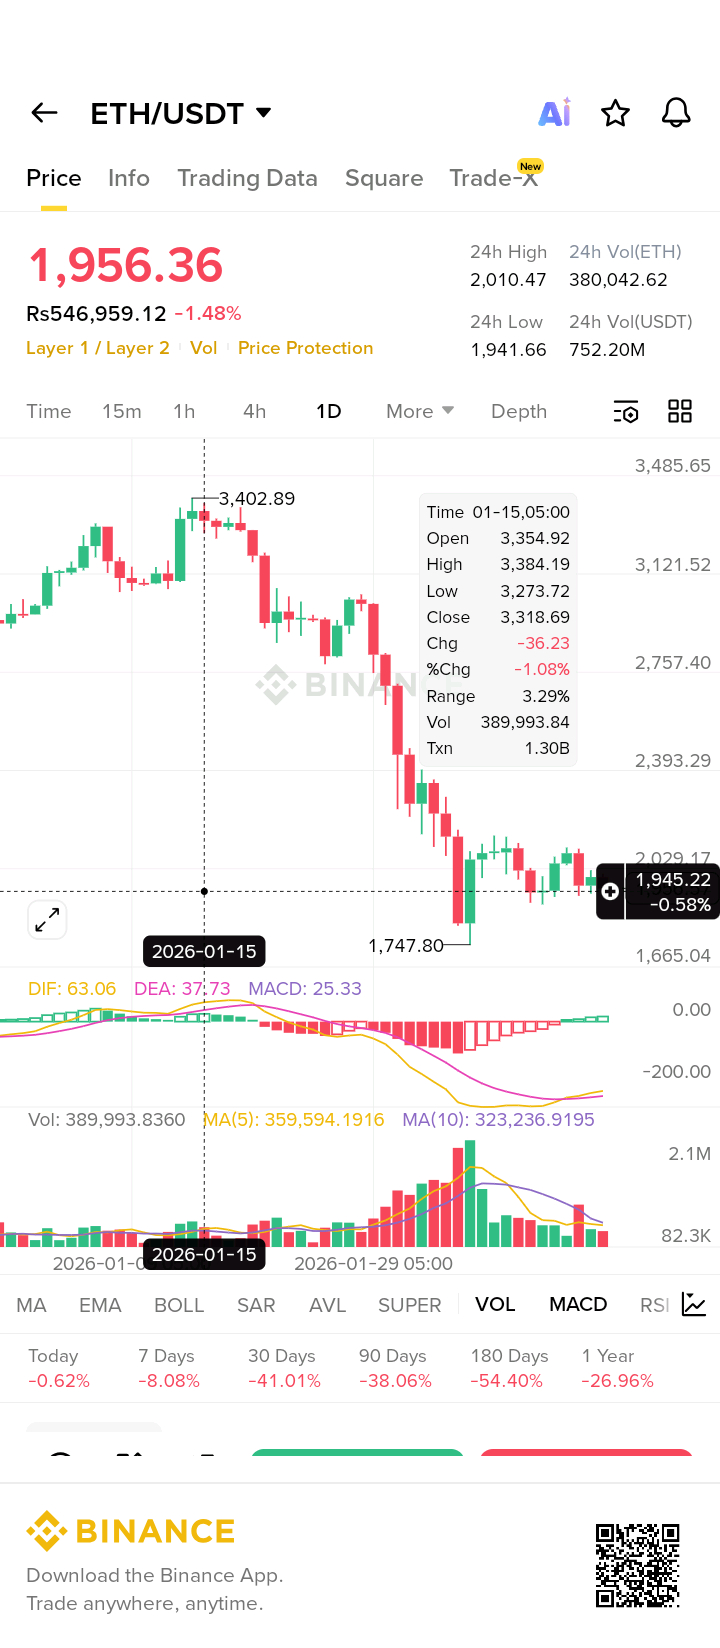
What the Chart Shows
1. Strong Downtrend
ETH dropped from around $3,400 down to $1,747 at the lowest.
Current price around $1,950 shows weak recovery.
Red MACD bars (histogram) = bearish momentum still present.
2. MACD Weak but Turning
MACD lines (yellow & pink) are:
Still below zero → market still bearish
But getting closer → possible small bounce, not a full reversal yet.
3. Volume is Low
Falling volume means: no big buyers yet
Low volume normally means no strong trend reversal.
🎯 ETH Price Prediction Range (Short-Term)
Based only on chart data:
📉 Possible Downside (Support Levels)
$1,850 – First support
$1,750 – Strong support (previous bottom on chart)
$1,650 – Extreme support if market dumps
📈 Possible Upside (Resistance Levels)
$2,050 – First resistance
$2,250 – Strong resistance
$2,450–$2,500 – Needs big volume to break
🔮 Technical Prediction
Next 7–14 Days
ETH likely moves between $1,850 – $2,150
Sideways with small pumps (because MACD is flattening)
Bullish Scenario
If ETH breaks $2,150 with volume →
Target: $2,300 → $2,450
Bearish Scenario
If ETH breaks $1,850 →
Target: $1,750 → $1,650
🧠 Simple Summary for You
ETH is not in strong bullish mode yet.
It's trying to form a bottom near $1,750–$1,950.
Need MACD crossover + volume to confirm an uptrend.
If you want, I can make: ✅ A trading plan (Long/Short points)
✅ Risk-free entry levels
✅ Prediction for 1 month, 3 months, or 2026 end$ETH $BNB $XRP