

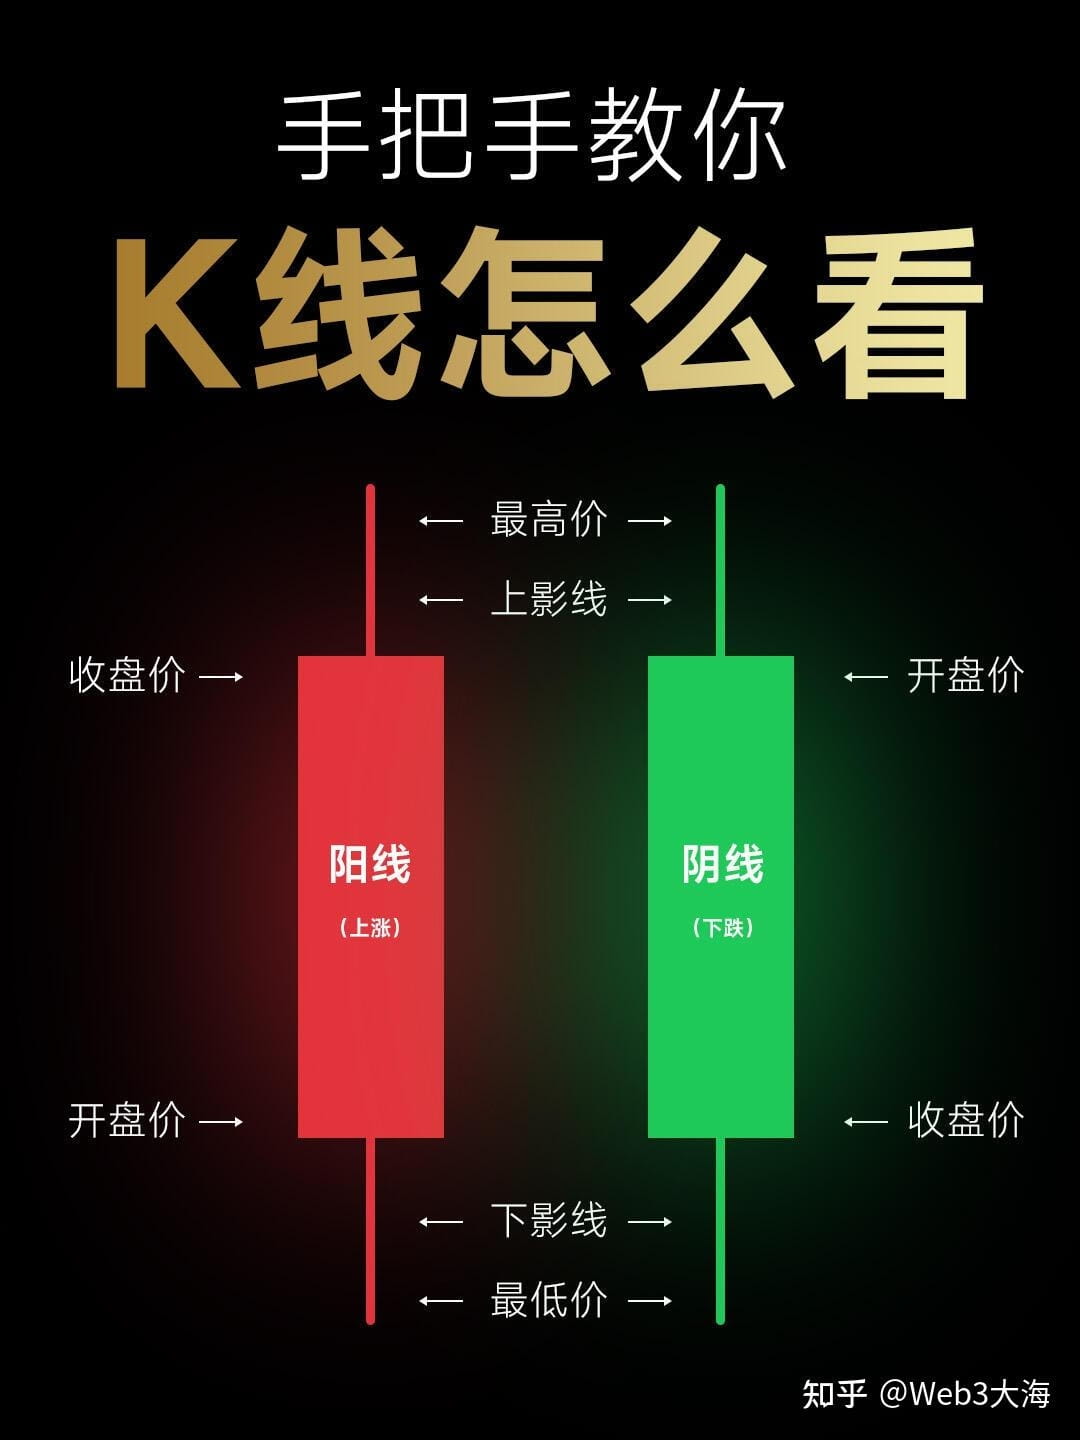
The candlestick chart (Candlestick Chart), also known as Yin Yang Line, is a graphical representation that displays the opening price, closing price, highest price, and lowest price of various stocks within a certain time unit through a drawing method.
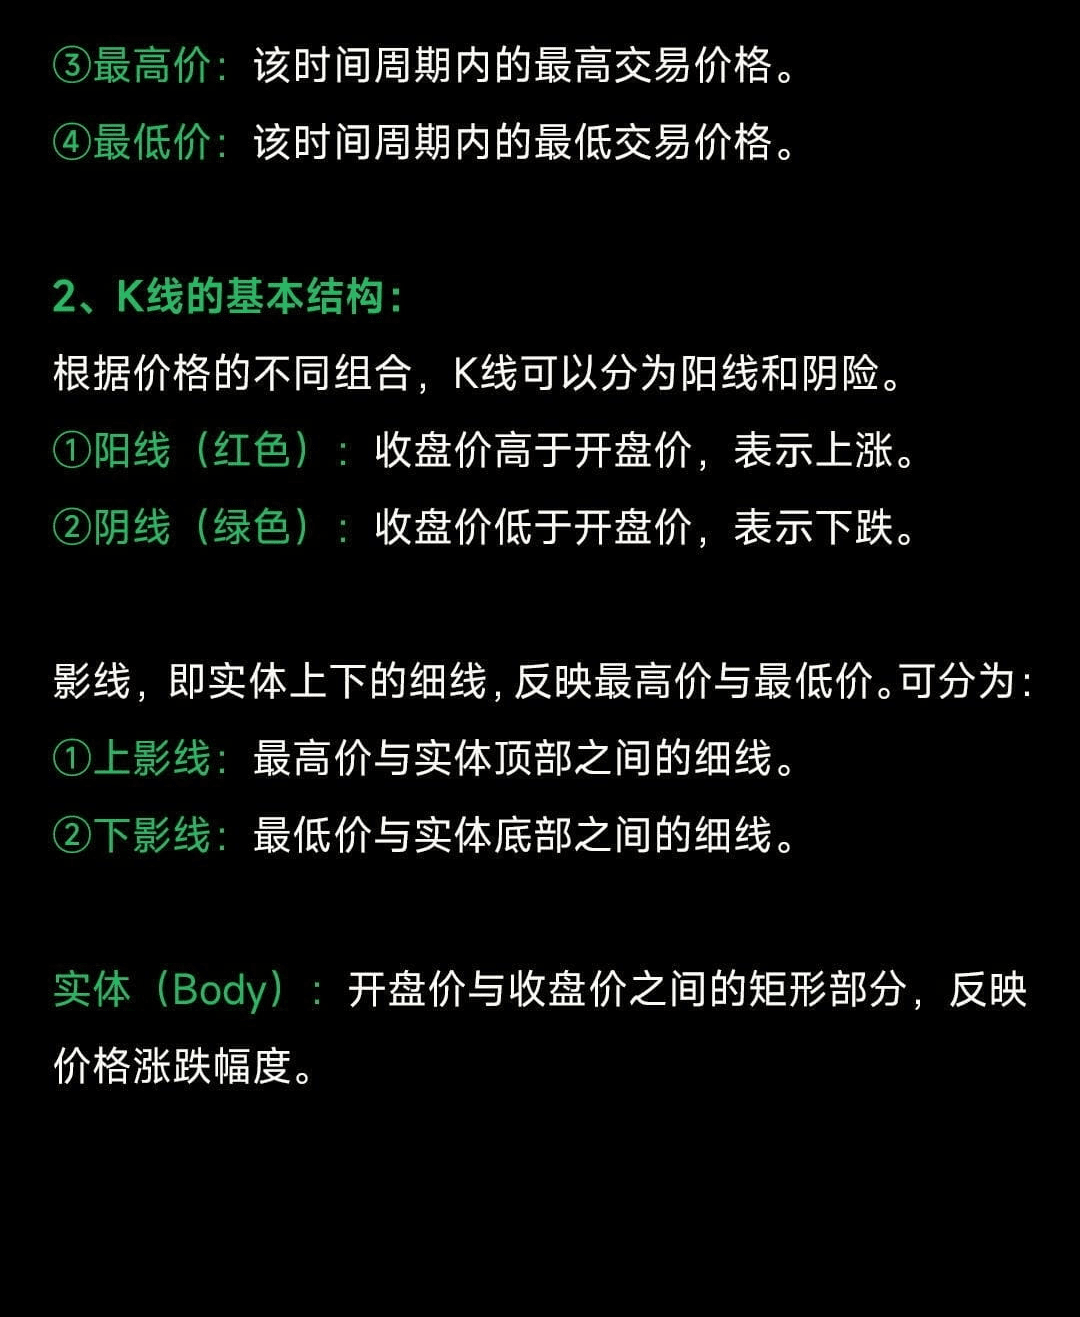
The candlestick chart originated from the Japanese anchor chart. In 1991, Steve Nison, an American futures investment expert, published 'Japanese Candlestick Charting Techniques,' which systematically introduced the candlestick chart to the West for the first time. The structure of the candlestick chart mainly consists of the body, upper shadow, and lower shadow, with the main components being the opening price, closing price, highest price, and lowest price. Based on the calculation period of the candlestick, it can be divided into daily candlesticks, weekly candlesticks, monthly candlesticks, and yearly candlesticks. The weekly candlestick refers to the candlestick chart drawn using the opening price on Monday, the closing price on Friday, the highest price for the week, and the lowest price for the week. The monthly candlestick is drawn using the opening price on the first trading day of the month, the closing price on the last trading day of the month, and the highest and lowest prices for the month. Similarly, the definition of the yearly candlestick can be derived. Weekly and monthly candlesticks are commonly used to analyze medium-term market trends. For short-term traders, the 5-minute, 15-minute, 30-minute, and 60-minute candlesticks provided by various analysis software also hold significant reference value.
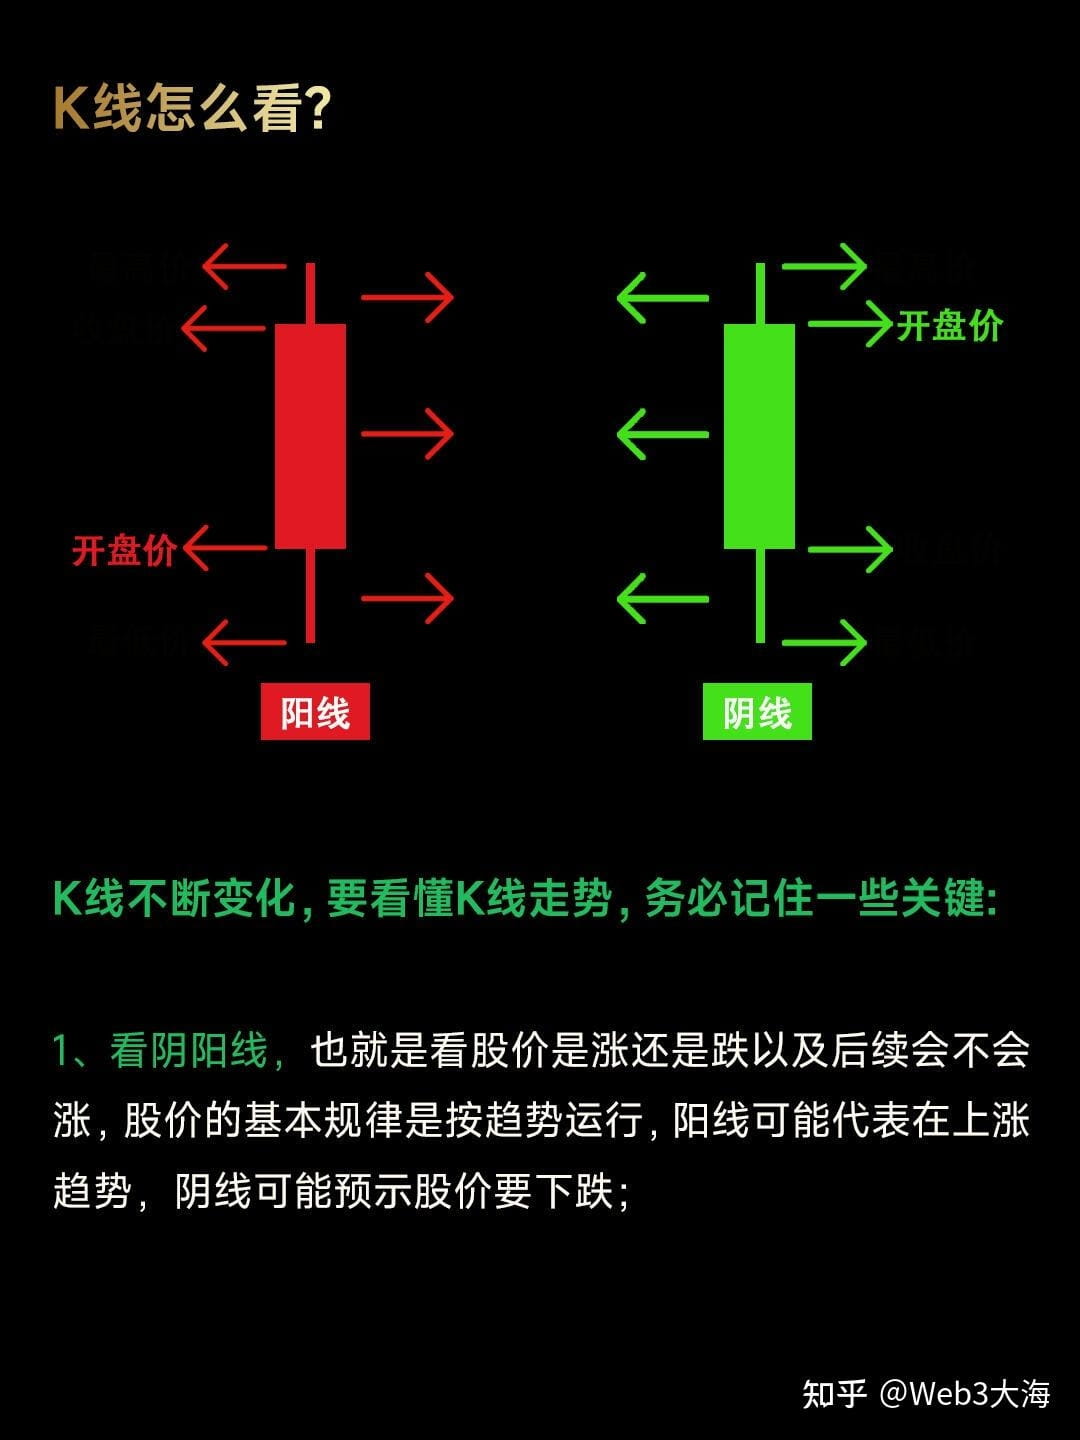
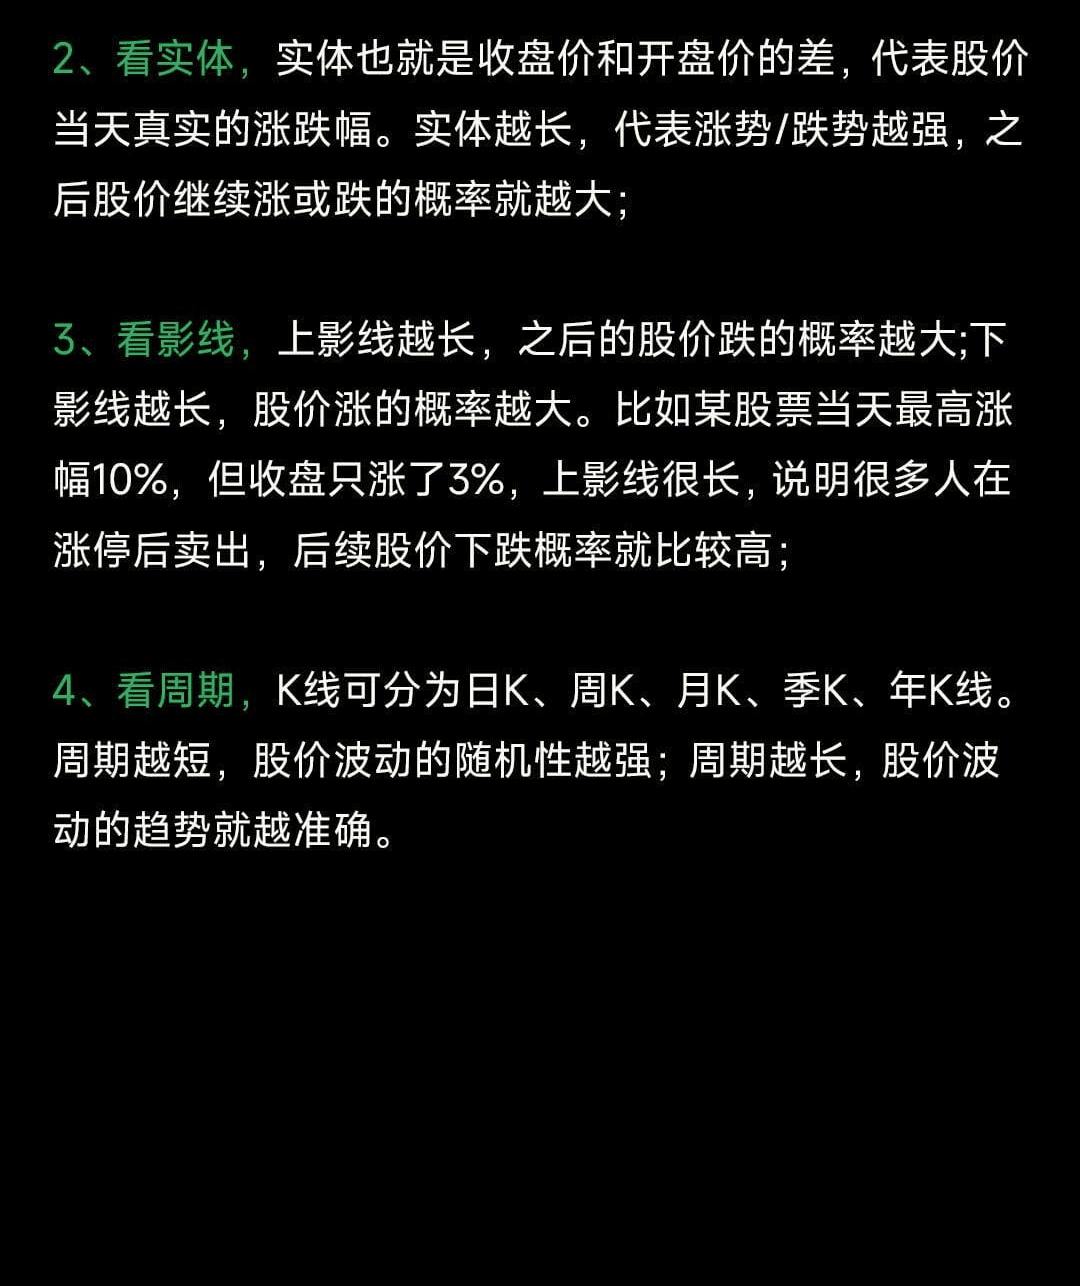
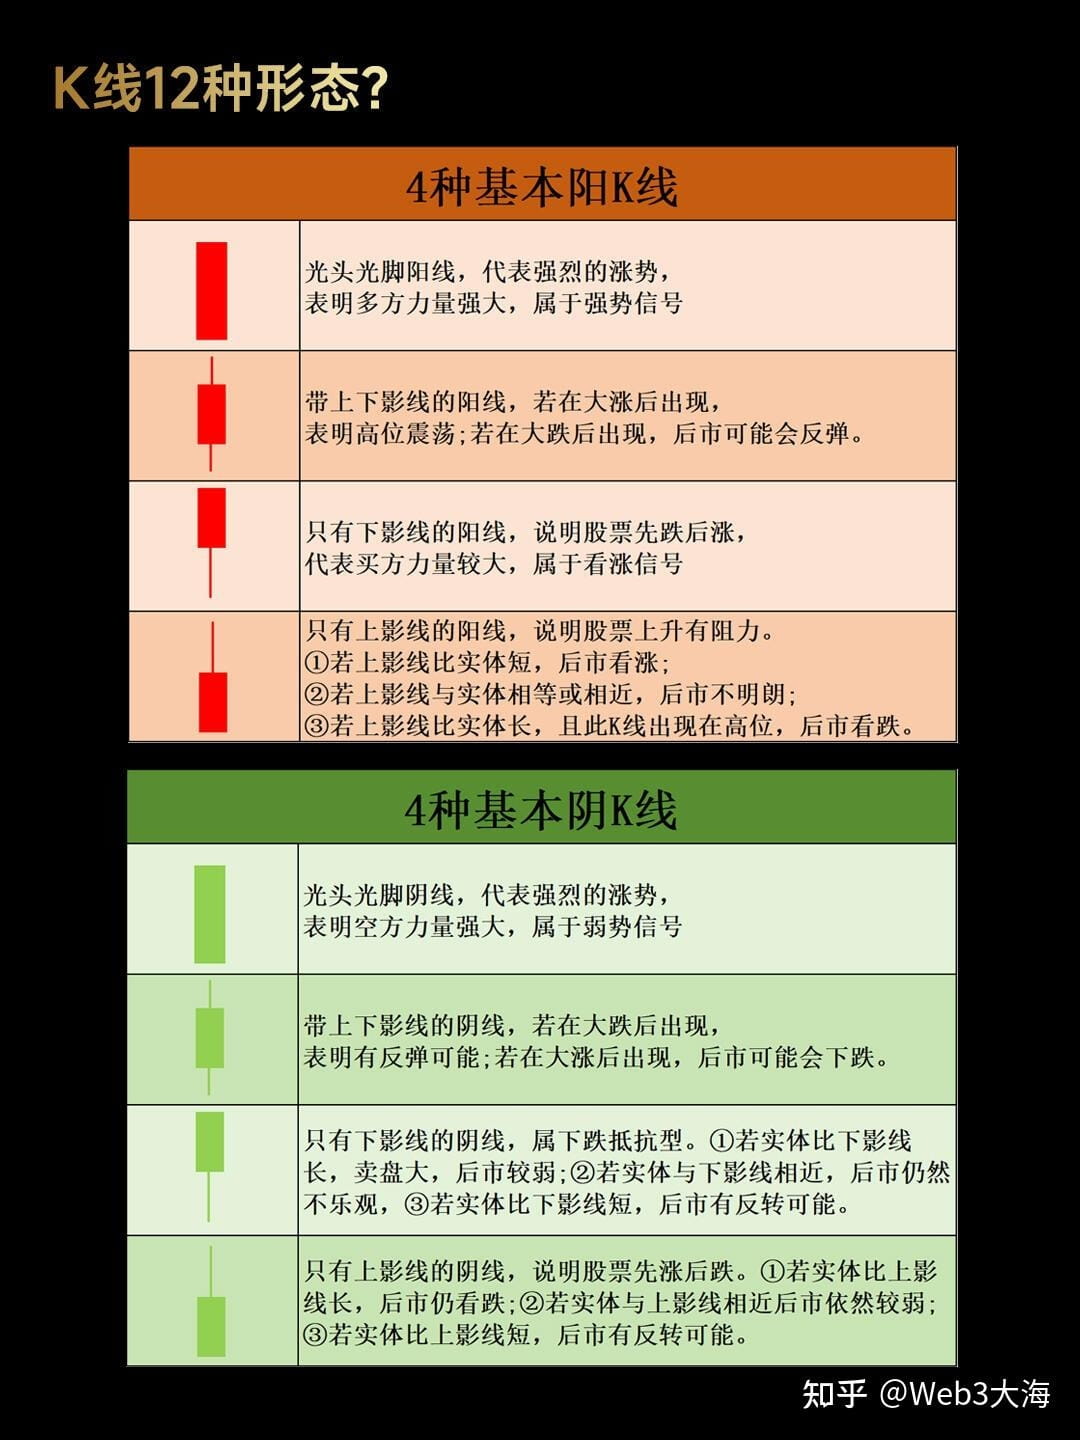
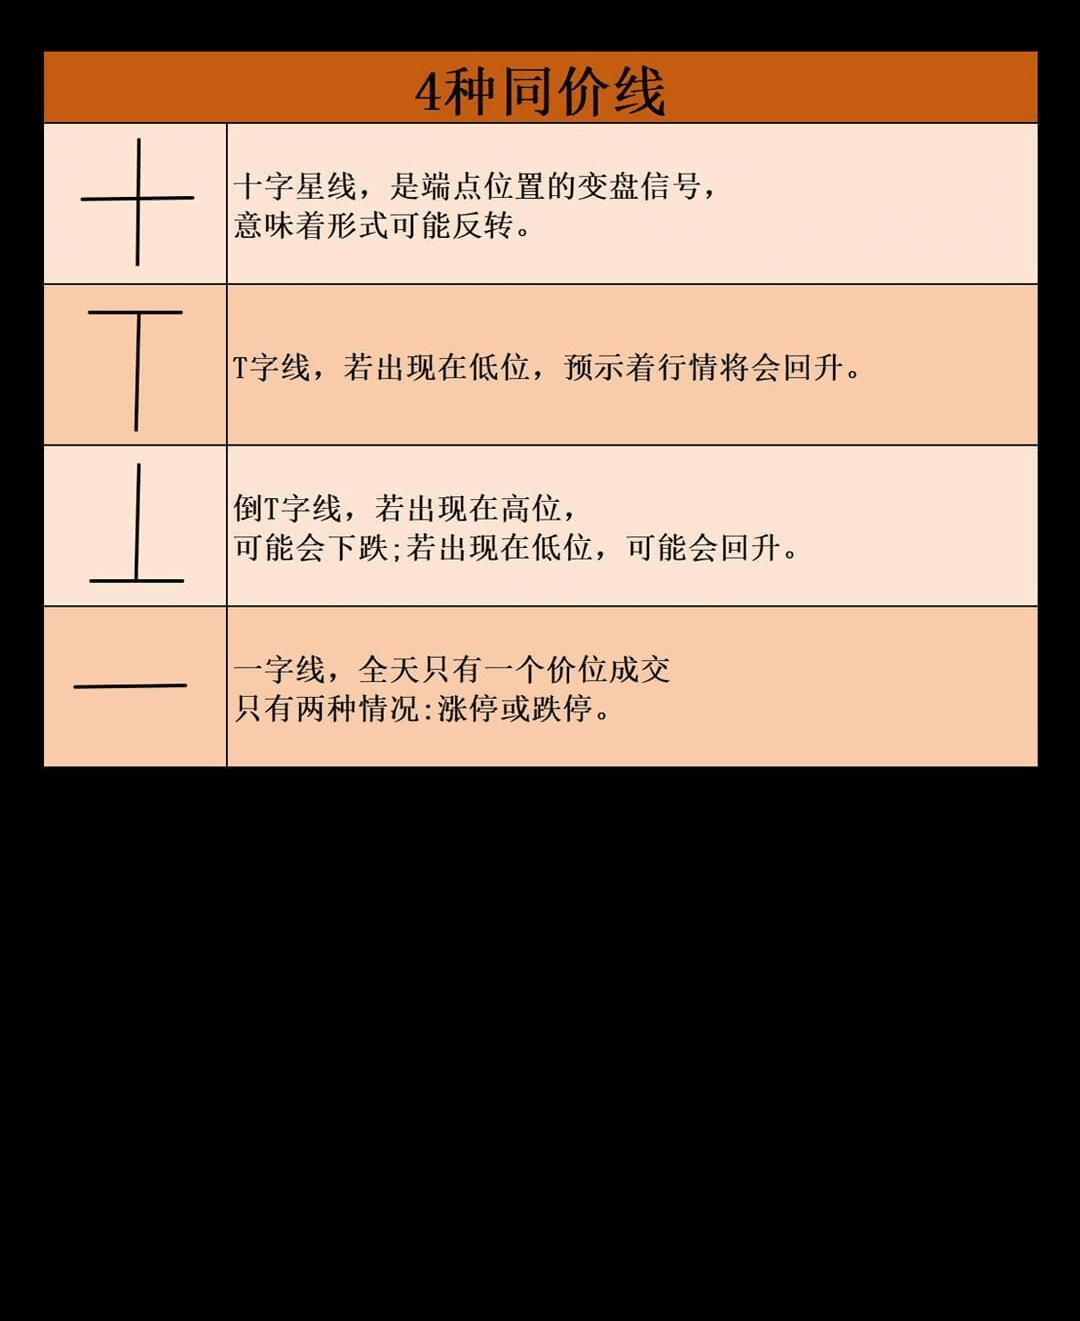
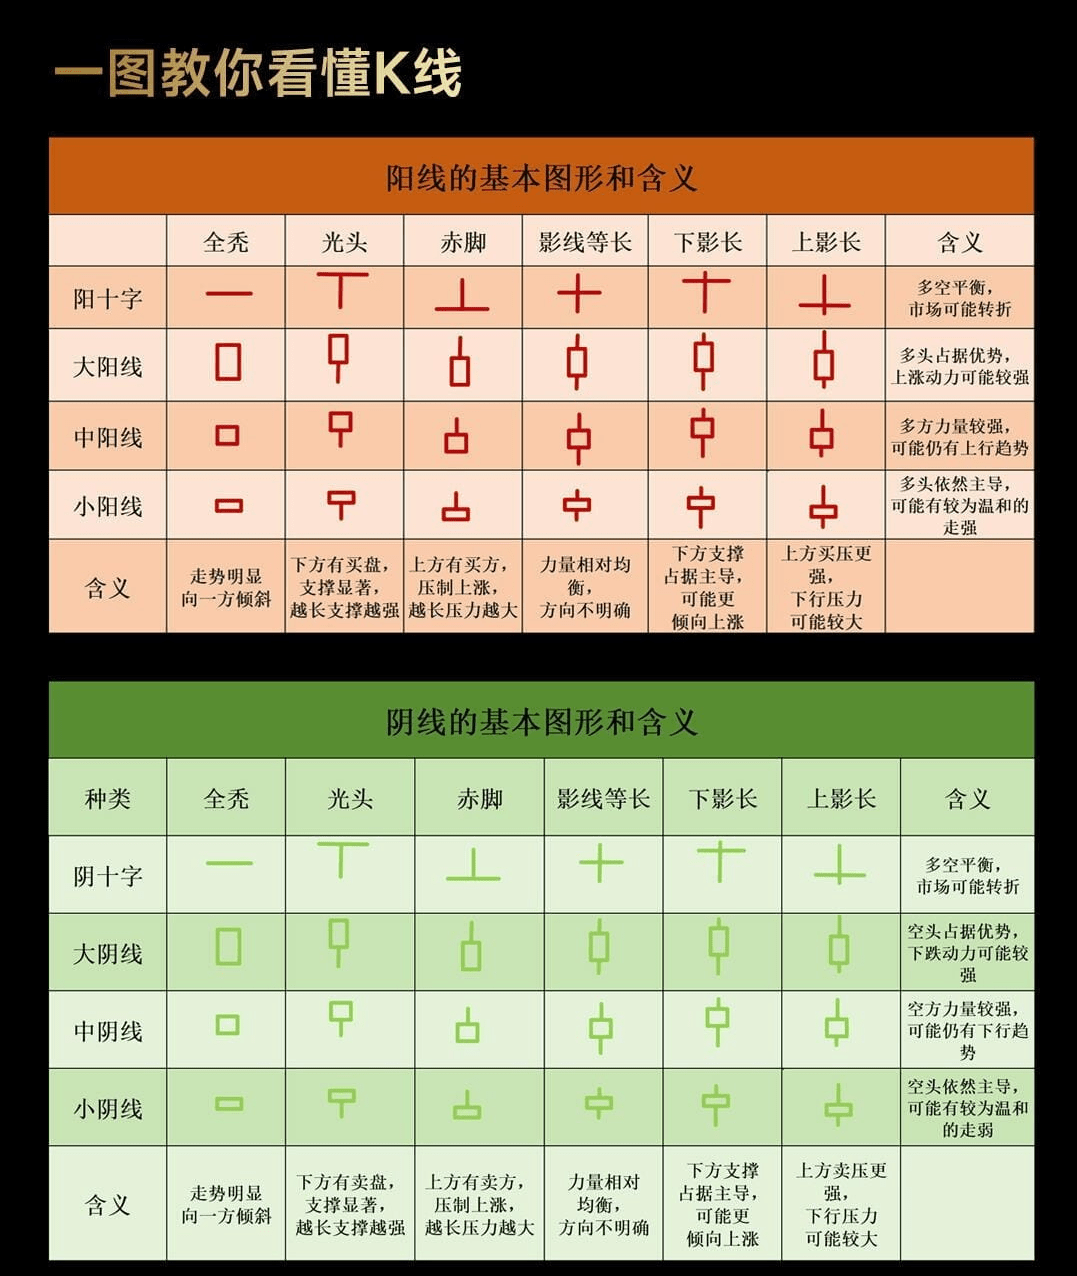
Through the K-line chart, it is possible to completely record the market performance of each day or a certain period. After a period of consolidation, the stock price forms a special area or shape on the chart, with different shapes displaying different meanings. In the field of trading and investment, the K-line chart is one of the most popular technical analysis tools.
I am the Great Master, a professional analyst and teacher, a mentor and friend on your investment journey! As an analyst, the most basic thing is to be able to help everyone make money. I will help you solve confusion and stuck positions, speaking with strength. When you are lost and don't know what to do, follow me, and the Great Master will point you in the right direction.