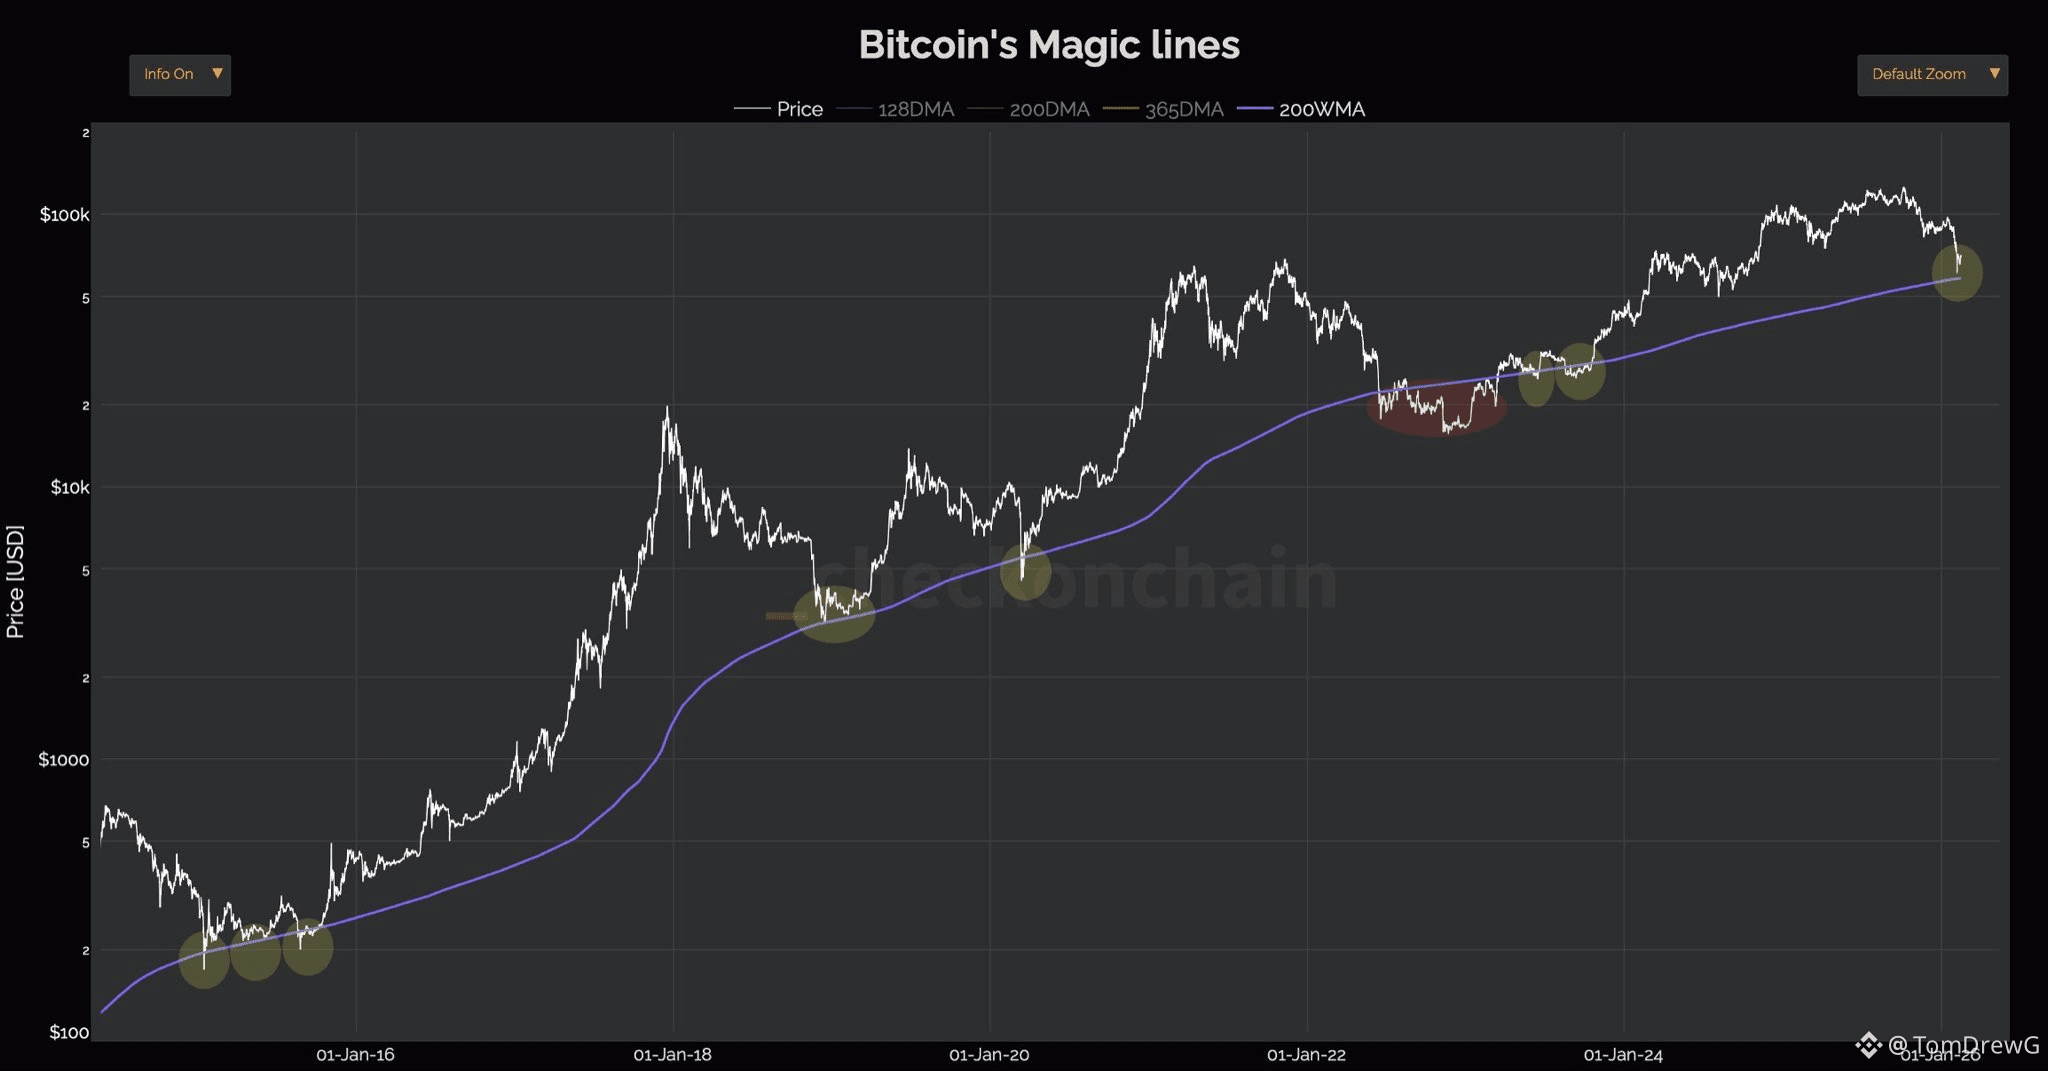
Bitcoin Magic Lines – showing the Bitcoin price over a long cycle, along with important moving averages such as 128DMA, 200DMA, 365DMA, and especially 200WMA
For over 10 years, whenever the Bitcoin price touches or slightly dips below 200WMA, it has almost always been the bottom of the cycle
We can see:
- 2015: Price touched 200WMA → started bull run 2017
- 2018–2019: Retested this area → preparing for the 2020–2021 cycle
- 2022: Broke below 200WMA during a severe bear market → formed a bottom and rebounded strongly
- 2023–2024: Price bounced up from the area around this line → continuing the upward trend
- 2026: Price is returning to test the long-term support area once again
Interestingly, with each cycle, the 200WMA slopes upwards over time. This means the structural bottom of Bitcoin is getting higher. This is an indication of an asset growing exponentially in the long term.
So what information does this chart provide us?
- 200WMA acts as the “death line” of the cycle
- Touches in this area often come with extremely negative sentiment
- But in historical context, this is a low-risk area – high profit
If history continues to repeat itself, the occurrence of $BTC returning to test the 200-week moving average is not a bad sign; on the contrary, it could be a preparation step for a new growth cycle.
Of course, nothing guarantees the future will resemble the past. But when a pattern is repeated across many different cycles, it is truly worth monitoring, isn’t it?
#BTC
For over 10 years, whenever the Bitcoin price touches or slightly dips below 200WMA, it has almost always been the bottom of the cycle
We can see:
- 2015: Price touched 200WMA → started bull run 2017
- 2018–2019: Retested this area → preparing for the 2020–2021 cycle
- 2022: Broke below 200WMA during a severe bear market → formed a bottom and rebounded strongly
- 2023–2024: Price bounced up from the area around this line → continuing the upward trend
- 2026: Price is returning to test the long-term support area once again
Interestingly, with each cycle, the 200WMA slopes upwards over time. This means the structural bottom of Bitcoin is getting higher. This is an indication of an asset growing exponentially in the long term.
So what information does this chart provide us?
- 200WMA acts as the “death line” of the cycle
- Touches in this area often come with extremely negative sentiment
- But in historical context, this is a low-risk area – high profit
If history continues to repeat itself, the occurrence of $BTC returning to test the 200-week moving average is not a bad sign; on the contrary, it could be a preparation step for a new growth cycle.
Of course, nothing guarantees the future will resemble the past. But when a pattern is repeated across many different cycles, it is truly worth monitoring, isn’t it?
#BTC