


Sober Options Studio × Derive.XYZ joint production

Written by Sober Options Studio analyst Jenna @Jenna_w5
1. Macro Overview: The true trigger of BTC's historic collapse and liquidity crunch
1) From 120,000 to 60,000: This is not a pullback, but a 'liquidity structural collapse'
In the past week, Bitcoin rapidly fell from a high of $120,000 to around $60,000, a decline of nearly 50%. This is not a traditional cyclical pullback, but a typical non-linear collapse driven by liquidity cascade.
To understand this round of decline, we must break out of the linear framework of 'negative news → price drop' and understand it from the feedback loop of derivatives structure, funding leverage structure, and options hedging behavior.
First-level trigger: The "vacuum moment" of liquidity.
The market crash wasn't caused by a single negative factor, but rather by a "collective disappearance of liquidity providers." Around $120,000, three key liquidity structures existed in the market: 1) passive funds holding large amounts of spot ETFs; 2) institutional arbitrage positions in carry trade (spot long + short futures); and 3) funds from option sellers earning premiums by selling puts.
These structures provide sustained buying pressure during upward cycles, but once prices fall below key levels, the mechanism completely reverses: 1) ETFs begin to experience continuous net outflows, and spot buying disappears; 2) Carry trade profits narrow or even turn negative, forcing institutions to liquidate their positions; 3) Short put sellers face rapidly widening Delta, forcing them to sell spot to hedge.
This forms a typical negative gamma feedback loop: price falls → sellers are forced to sell more physical goods → price falls further → triggering more passive selling.
This ultimately leads to a "vacuum" of liquidity, forcing prices to find new buyers only through sharp declines.
This is why BTC could be halved in a short period of time without a significant rebound.
Second-level trigger: Systemic deleveraging of leveraged structures
What truly accelerated the plunge was not the selling pressure in the spot market, but the forced deleveraging in the derivatives market. Data from futures funding rates and open interest show that before the crash: the perpetual contract funding rate remained positive for a long time, the market as a whole was in a state of "net long leverage," and leveraged funds became the marginal price setters.
When prices break below key support levels: long positions are forced into liquidity, market makers sell spot for gamma hedging, and leveraged funds transform from "liquidity providers" to "liquidity consumers".
This forms a typical Long Liquidation Cascade.
Historically, similar structures have only appeared in:
March 2020 COVID Crash
LUNA crashed in 2022
Correction before ETF approval in 2024
This is the largest ETF since the ETF era began.
The third trigger: the "collapse signal" issued in advance by the options market.
Truly astute investors had already used the options market for defense. In the week leading up to the crash, three key signals emerged in the options market:
Skew quickly turns negative: Put IV is significantly higher than Call IV
Short-term IV rises significantly
Large sums of money were used to buy OTM Put (out-of-the-money put options).
This means that the most professional funds in the market are paying insurance premiums for extreme price drops. The advantages of long-term put options are fully demonstrated at this moment:
Maximum loss is limited (Premium)
Returns grow non-linearly during declines
We don't need to predict the exact timeframe, we only need to predict the existence of the risk.
In contrast, spot long positions and leveraged long positions offer virtually no defense in the face of a liquidity crunch. This is why options are not "offensive tools," but rather survival tools.
Fourth layer: This is not the beginning of a bear market, but rather a repricing of liquidity.
It needs to be clarified that the core of this round of crash is not "BTC losing its long-term value", but rather: the market is repricing the risk premium of liquidity.
In other words, this is a leverage cleanup and risk redistribution, not a collapse of fundamentals.
Historical experience shows that after each systemic deleveraging, the market enters a healthier structural cycle.
Fifth layer: Future strategy – Cash is king, not blindly buying the dip.
At this juncture, the most important thing is not predicting a rebound, but managing the probability of survival. The current market exhibits three characteristics:
IV remains high
Liquidity has not fully recovered
Macroeconomic uncertainty remains extremely high
Therefore, there is only one core strategy: Cash is a Position.
Specific allocation logic: increase cash ratio, wait for liquidity to recover, avoid using leverage, use options to create non-directional returns, and only gradually build structured positions in extreme IV environments.
After a liquidity crisis, the biggest risk is not missing out on the rebound, but running out of capital at the wrong time.
The market will always give you a second chance, but only if you're still there.
2) 2026: Black swan events are forming, and volatility will become the norm.
If this round of sharp decline is a liquidity structure problem, then the core theme of 2026 will be: macroeconomic uncertainty. Two key variables could become the "black swan" events that determine the medium-term trend of BTC.
Variable 1: U.S. Supreme Court tariff ruling
The market is currently awaiting the US Supreme Court's final ruling on the legality of Trump's tariff policies. The core impact path is very direct:
If the ruling is illegal:
The U.S. government may need to refund tariffs to businesses.
Equivalent to releasing fiscal liquidity
Risk assets (including BTC) benefit
If the tariff ruling is legal:
Inflationary pressures persist
The Fed's room for interest rate cuts is limited.
Risky assets under pressure
This will directly impact the global liquidity cycle. And BTC, in essence, is a "high-beta asset" with global liquidity.
Variable 2: Uncertainty surrounding Donald Trump's policies and the 2026 midterm elections
A new trading theme has emerged on Wall Street: Big MAC (Big Midterms Are Coming). With the midterm elections approaching, policy uncertainty has increased significantly: increased government intervention in corporate behavior, challenges to the independence of the Federal Reserve, and potential changes in financial regulatory policies.
These factors will directly affect: dollar liquidity, risk appetite, demand for crypto asset allocation, and so on.
Final conclusion: Prepare for volatility, not bet on direction.
Black swan events are not necessarily bad for BTC. They may cause a sharp drop or a sharp rise, but what is certain is that high volatility will persist.
Therefore, the optimal strategy is not All-in, but rather:
Keep cash
Using options to generate cash flow (Short Premium Strategy)
Gradually build long-term positions amid extreme panic.
In this new era, Bitcoin is not a linearly appreciating asset, but a volatile asset. And options are the only tool to manage volatility.
II. In-depth analysis of BTC & ETH options market data
After last week's epic liquidity squeeze, which saw a drop from 120,000 to 60,000, the market has entered a very unusual period of "consolidation and recovery" this week. By observing the volatility data provided by Amberdata & Derive.XYZ, we can clearly see how the panic subsided from its peak, but how defensive pricing is deeply rooted in the current term structure.
Skewness: The V-shaped reversal of short-term sentiment and the long-term "indifference"
By observing the Delta 25 Skew (Implicit Volatility IV of Call Options - Implicit Volatility IV of Put Options), the negative magnitude of this indicator reflects the market's demand for hedging against downside tail risk.
Skew Observation: As prices initially stabilized around 70,000, panic selling subsided significantly. The overall Skew has now recovered to around -10. The most interesting change occurred at the very short end of the 1-3 day ATM: this indicator briefly broke through the zero line and entered positive territory this week.
In-depth analysis: The short-term Skew turning positive does not signify the return of a major bull market, but rather resembles a game of wits after the "panic has subsided"—short covering and funds seeking short-term rebounds are pricing higher in short-term call options. However, the long-term lines, such as the ATM 180, remain firmly anchored near zero, indicating that large funds have become extremely "neutral and cautious" regarding the macroeconomic cycle. They do not believe in an immediate reversal, nor are they blindly panicking. This divergence between the long and short ends is a typical "bottom-finding" signal.
BTCÐ
Term Structure: A persistent inverted price pattern
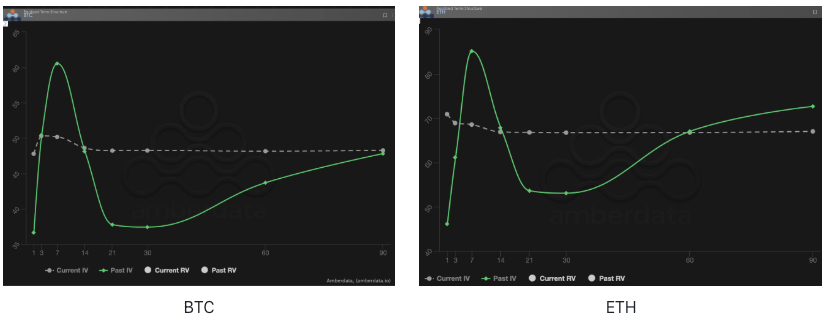
Term Structure shows the distribution of Implied Volatility (IV) for different maturities.
Pattern Anomaly: Observe the comparison between Current IV (gray dashed line) and Past IV (green solid line). Currently, Current IV is still in a backwardation state, meaning the near-term IV is higher than the far-term IV. Unlike last week's "spiky" backwardation where the near-term IV soared, this week, as the decline slowed, the near-term IV has fallen back, and the current line body shows a "flattened backwardation".
In-depth analysis: This atypical situation indicates that although last week's "sudden panic" has dissipated, the market remains highly vigilant about near-term (1-30 days) volatility. Current IV has almost flattened out in the short to medium term, mirroring the longer-term trend. This reveals a harsh reality: after suffering huge losses last week, sellers are no longer willing to sell near-term volatility cheaply, while buyers are hesitant to short volatility due to concerns about "black swan" events such as tariff rulings. The market is stuck in a stalemate where "no one trusts anyone else."
BTCÐ
Volatility Risk Premium (VRP): The Darkest Hour for Sellers and the Quagmire of "Negative Premiums"
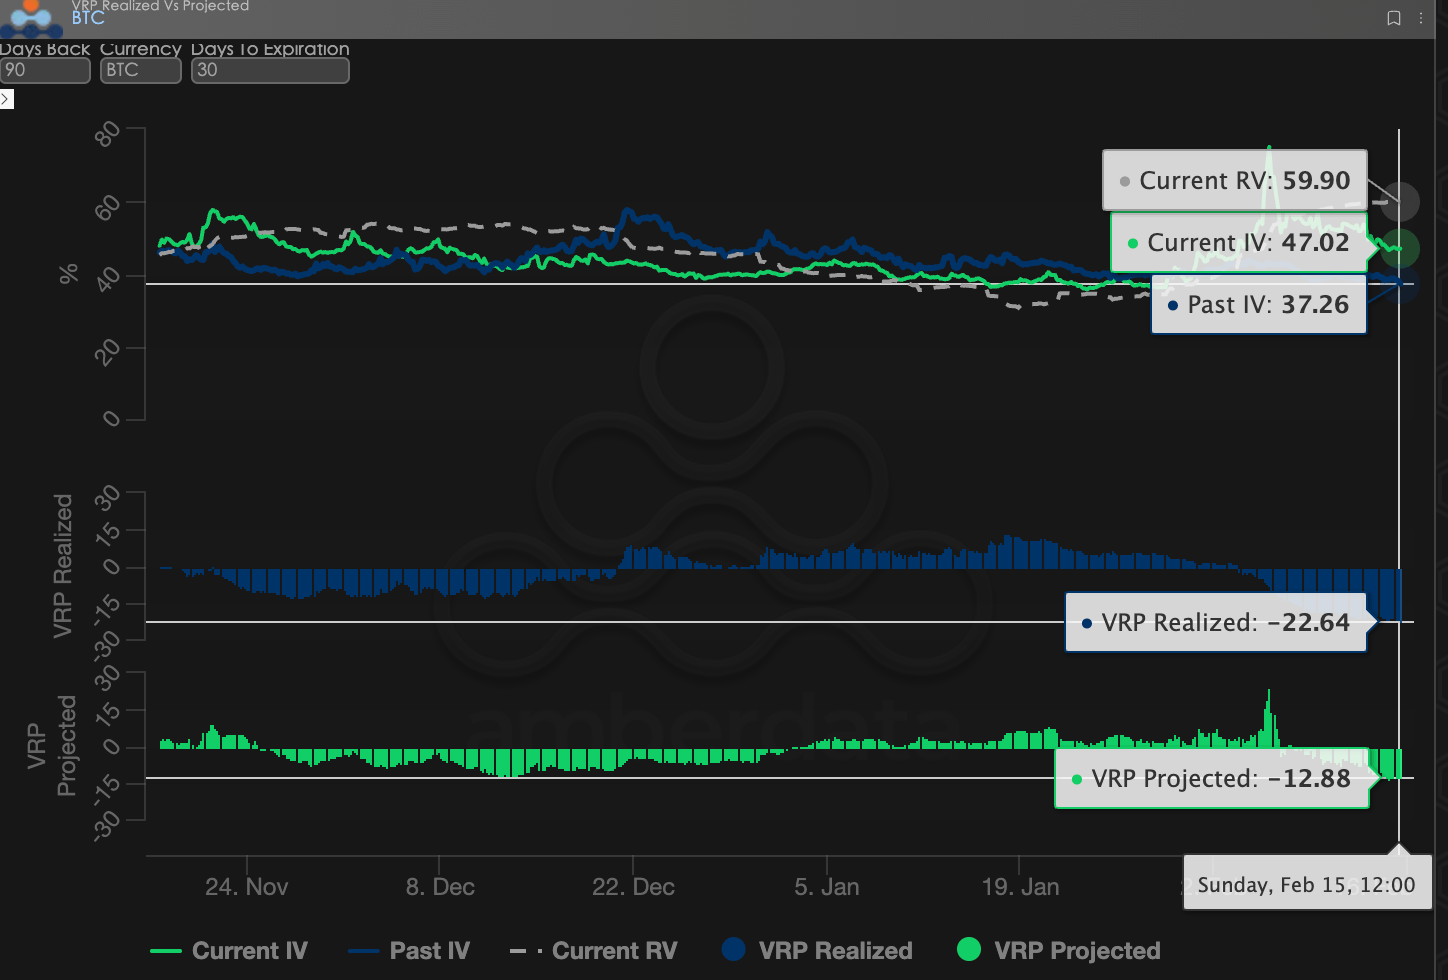
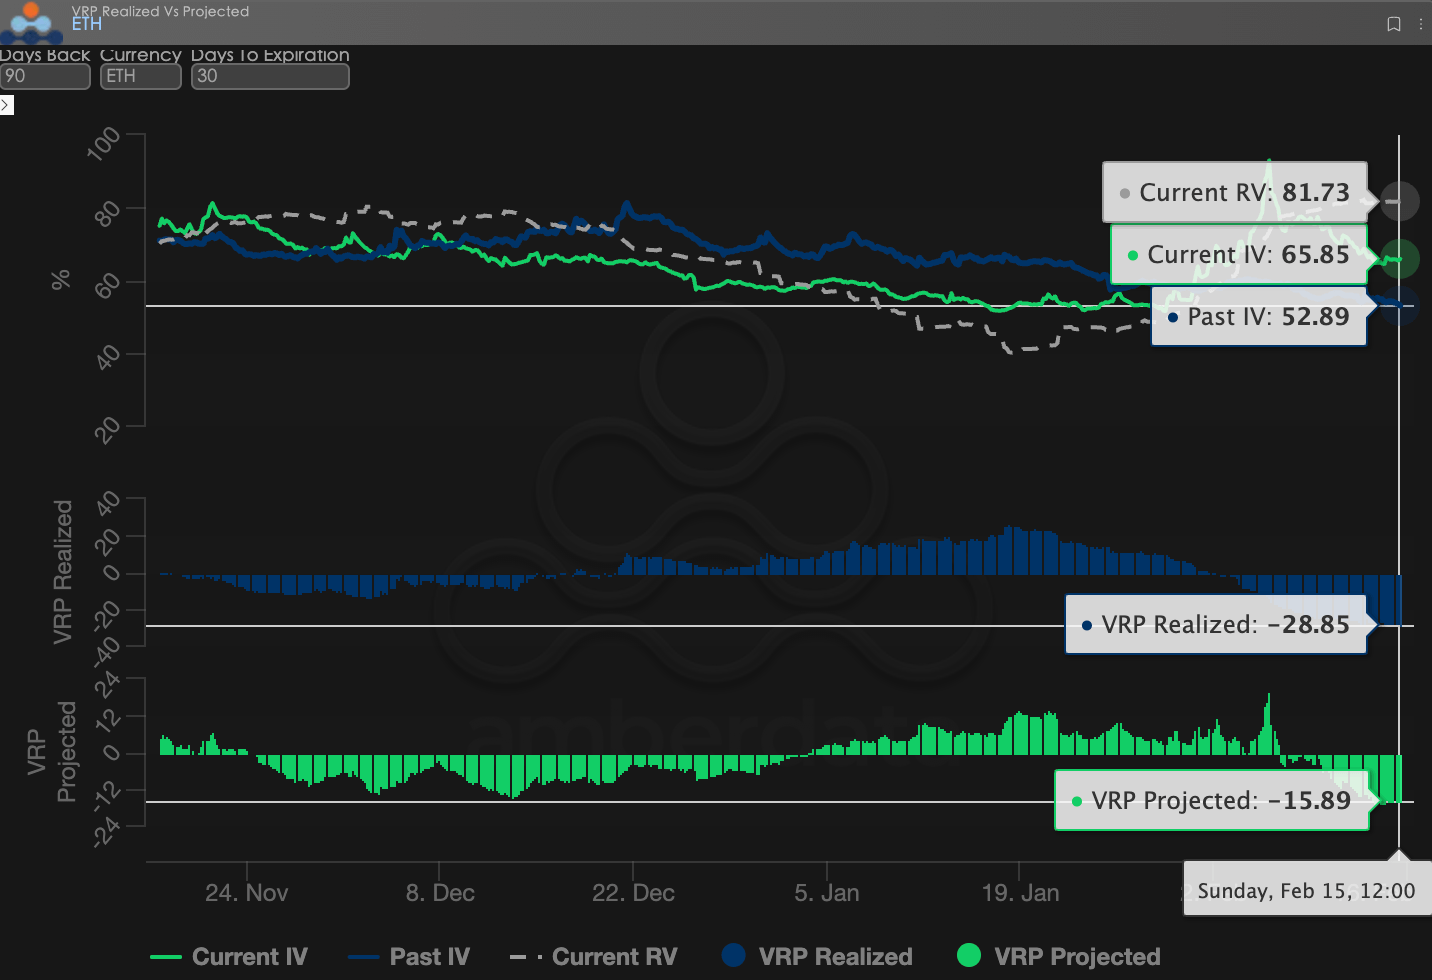
VRP (Volatility Risk Premium = Implied Volatility IV - Realized Volatility RV) is an important indicator for measuring whether option pricing is reasonable. The market is currently in a correction phase.
During the market downturn, realized volatility (RV) remained high, while current volatility (IV) was low. VRP Projected remained in negative territory around -12.88. This means that even after the market crash, current option prices are still "too cheap" to cover the actual cost of asset volatility.
Market Insight: The biggest risk right now is the lack of market imagination. The IV (Inverse Scale) lagging behind RV (Reverse Scale) indicates that market funds have dried up, or that traders are afraid of further declines and dare not offer higher valuation premiums for future rebounds or volatility. In this environment of negative VRP (Vega), simply acting as a seller (Short Gamma/Vega) is tantamount to picking up coins in front of a steamroller.
BTCÐ
Options Data: A Trader's "Third Eye" and Multidimensional Pricing Power
In the complex macroeconomic environment of 2026, simple price movements (spot price) are often lagging, while options data is the trader's "third eye," able to see through appearances to the true defensive boundaries of funds.
The data dimensions to be observed should differ significantly depending on the trading style:
Short-term/day traders (Gamma Scalpers): They should closely monitor the 1-3 dte Gamma Exposure (GEX) distribution. For example, during the volatility following the Fed's change of leadership on January 30th, the concentrated strike price of GEX formed extremely strong physical support and resistance, helping short-term funds to exit precisely before liquidity dried up.
Trend/Swing Traders: Focus on the 25 Delta Skew and VRP Projected. When the Skew remains at extremely low negative values while the VRP remains high, it often indicates excessive market panic and is a typical "buy the dip" signal.
Institutional investors/long-term hedgers (Hedgers): They need to look beyond the term structure to observe changes in the long-term Vega. For example, by comparing the deviation of the current IV from the 90-day average, they can determine whether the current "insurance" is too expensive, thus deciding whether to directly buy a Put or construct a more complex portfolio strategy.
Options data provides a dual dimension of "probability" and "cost." To help investors better capture these asymmetric opportunities, Sober Options Studio now offers a customized options data tracking and research report service, providing in-depth profiles tailored to your specific positions and risk preferences. Feel free to contact us privately for inquiries.
III. Recommended Options Strategy: Collar Strategy for Locking in Downside Risk
In the aftershocks of the "120,000 to 60,000" drop, the scarcest commodity in the market is cash flow, and the heaviest asset is capital. At this point, simply buying put options results in extremely rapid depreciation of the time value (Theta), and is also constrained by very high implied volatility (IV), making the premiums exorbitantly expensive.
To balance the need for protection with the cost of holding positions, the Collar Strategy is the preferred hedging tool in the current environment of uncertainty.
3.1 Strategy Construction Logic
The collar strategy is essentially to put a "protective shield" on your spot trading, giving up the extremely low probability of excessive surge profits in exchange for low-cost (or even zero-cost) bottom defense.
Long Underlying: Suppose you hold BTC or ETH in the spot market.
Buying a long out-of-the-money put option (Long OTM Put): Establishes a physical stop-loss level to prevent another liquidity collapse caused by a "black swan" event.
Selling out-of-the-money call options (Short OTM Call): Take advantage of the recent rebound in short-term skew and the slight increase in call prices to sell the premium at the upper resistance level, using it to offset the cost of the lower put.
3.2 Practical Parameter Recommendations (Taking BTC as an Example)
In extreme market conditions where VRP (Volatility Risk Premium) is negative and IV (Vibration Risk Premium) remains inverted, the Collar strategy must precisely balance "insurance depth" and "cost hedging." The following are allocation recommendations for market conditions in mid-February 2026:
Underlying asset: 1 BTC (spot holding, cost approximately 65,000 - 70,000 USD)
Buy a long put option:
Strike price: 52,000 - 55,000 (Delta = -0.25)
Expiry Date (DTE): 30 - 45 days
Logic: Lock in the "deep risk" below 55,000. Even if liquidity drops to zero again, your maximum drawdown will be kept within an acceptable range.
Selling a short call option:
Strike price: $72,000 - $75,000 (Delta = 0.20)
Expiry Date (DTE): Same as above
Logic: Utilize the current window of opportunity presented by the short-term skew rebound to sell put options with an expected upside of over 72,000. The premium collected should fully cover the insurance costs of the aforementioned put options, achieving "zero-cost hedging."
Operational Note: If the price of BTC does not fluctuate significantly before the expiration date, this strategy will naturally fail. You will only lose the "potential gains" exceeding 72,000, but you will be spared the psychological pressure of having your assets halved in the past 30 days.
3.3 Why choose Collar instead of simply Bear Spread now?
While we maintain a bearish outlook for 2026 on a macro level, Collar has two major advantages over Bear Put Spread in the current environment:
Zero-Cost Hedging: Given the current near-term skew recovery, the premium recovered from selling a call option often fully covers the cost of buying a put option. This is a "zero-cost" insurance policy for investors who lost cash flow during last week's sharp decline.
Resisting the Vega Crush: With IV currently in a high-level pullback, if you only buy Put options, Vega and Theta will double-wage your premiums once the market enters a period of decline or volatility. Collar, by buying and selling, partially offsets the asset impairment pressure brought about by the decline in volatility (IV Crush).
In 2026, a year where "cash is king," the Collar strategy is like buying a "work relief" insurance policy for your crypto assets. You use the expected profits above (those temporarily unforeseen rebounds) to pay for the survival costs below. As long as the market doesn't fall below your put's strike price, you still hold the spot asset, waiting for the cycle to return.
IV. Disclaimer
This report is based on publicly available market data and options theory models, aiming to provide investors with market information and professional analytical perspectives. All content is for reference and exchange only and does not constitute investment advice of any kind. Cryptocurrency and options trading involves extremely high volatility and risk, which may result in the total loss of principal. Before adopting any trading strategy, investors should fully understand the characteristics and risk attributes of options products and their own risk tolerance, and must consult a professional financial advisor. The analysts in this report are not liable for any direct or indirect losses arising from the use of the content of this report. Past market performance is not indicative of future results; please make rational decisions.
Jointly produced by: Sober Options Studio × Derive.XYZ