Fly, analyze the pending order price of Ether

Post

K线人生飞哥
·
--
Through $BNB star line to see the short-term key points and future bear market bottom hanging order points
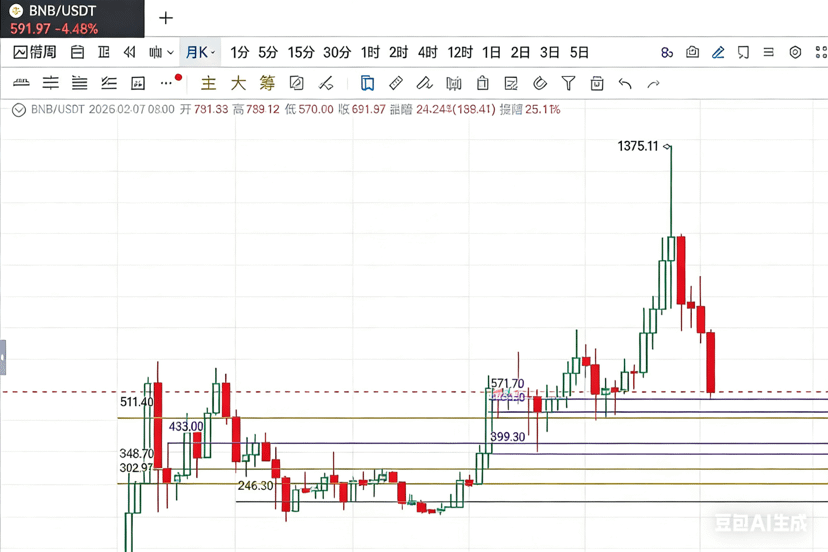
First, look at Image 1 (traces of the operator)
Recently, this wave of pullback has already pierced to the recent monthly peak 571,
The market clearly supports at 528, 511
If it continues to go down, the structural points below are as follows:
First hanging order point 433
Second hanging order point 399
Third hanging order point 348
As for the lower positions 302, 246, that was the extreme operating area of the previous round, theoretically possible, but the real probability is very low.
From the perspective of operating logic, I also tend to think that 433, 399 are most likely the extreme defensive zones.
If the operator wants to maintain this round's structure and continue to control the market, they are not very willing to let the price drop too much.
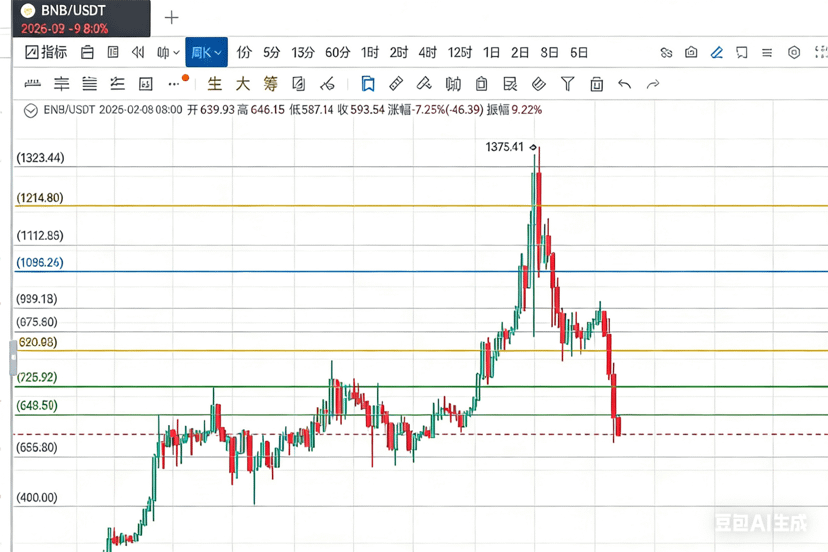
Image 2 (star line)
The rising star line has reached 9, but the key is that 535, 400 have not truly been lost.
The structure given by the downward perspective:
Short-term pressure 632
Short-term support 533
And 533 just coincides with the peak volume of 528, 505.
This is indeed the core area of the tug-of-war between bulls and bears.
Don't panic at low positions, don't be greedy at high positions.
For BNB, Image 1 is more stable than Image 2, because its operating traces are more obvious than emotional fluctuations.
There are not many turning points now,
I am not in a hurry to draw conclusions, let's wait for the structure to unfold before discussing further.
First, look at Image 1 (traces of the operator)
Recently, this wave of pullback has already pierced to the recent monthly peak 571,
The market clearly supports at 528, 511
If it continues to go down, the structural points below are as follows:
First hanging order point 433
Second hanging order point 399
Third hanging order point 348
As for the lower positions 302, 246, that was the extreme operating area of the previous round, theoretically possible, but the real probability is very low.
From the perspective of operating logic, I also tend to think that 433, 399 are most likely the extreme defensive zones.
If the operator wants to maintain this round's structure and continue to control the market, they are not very willing to let the price drop too much.
Image 2 (star line)
The rising star line has reached 9, but the key is that 535, 400 have not truly been lost.
The structure given by the downward perspective:
Short-term pressure 632
Short-term support 533
And 533 just coincides with the peak volume of 528, 505.
This is indeed the core area of the tug-of-war between bulls and bears.
Don't panic at low positions, don't be greedy at high positions.
For BNB, Image 1 is more stable than Image 2, because its operating traces are more obvious than emotional fluctuations.
There are not many turning points now,
I am not in a hurry to draw conclusions, let's wait for the structure to unfold before discussing further.