Let's analyze my trades on Binance!
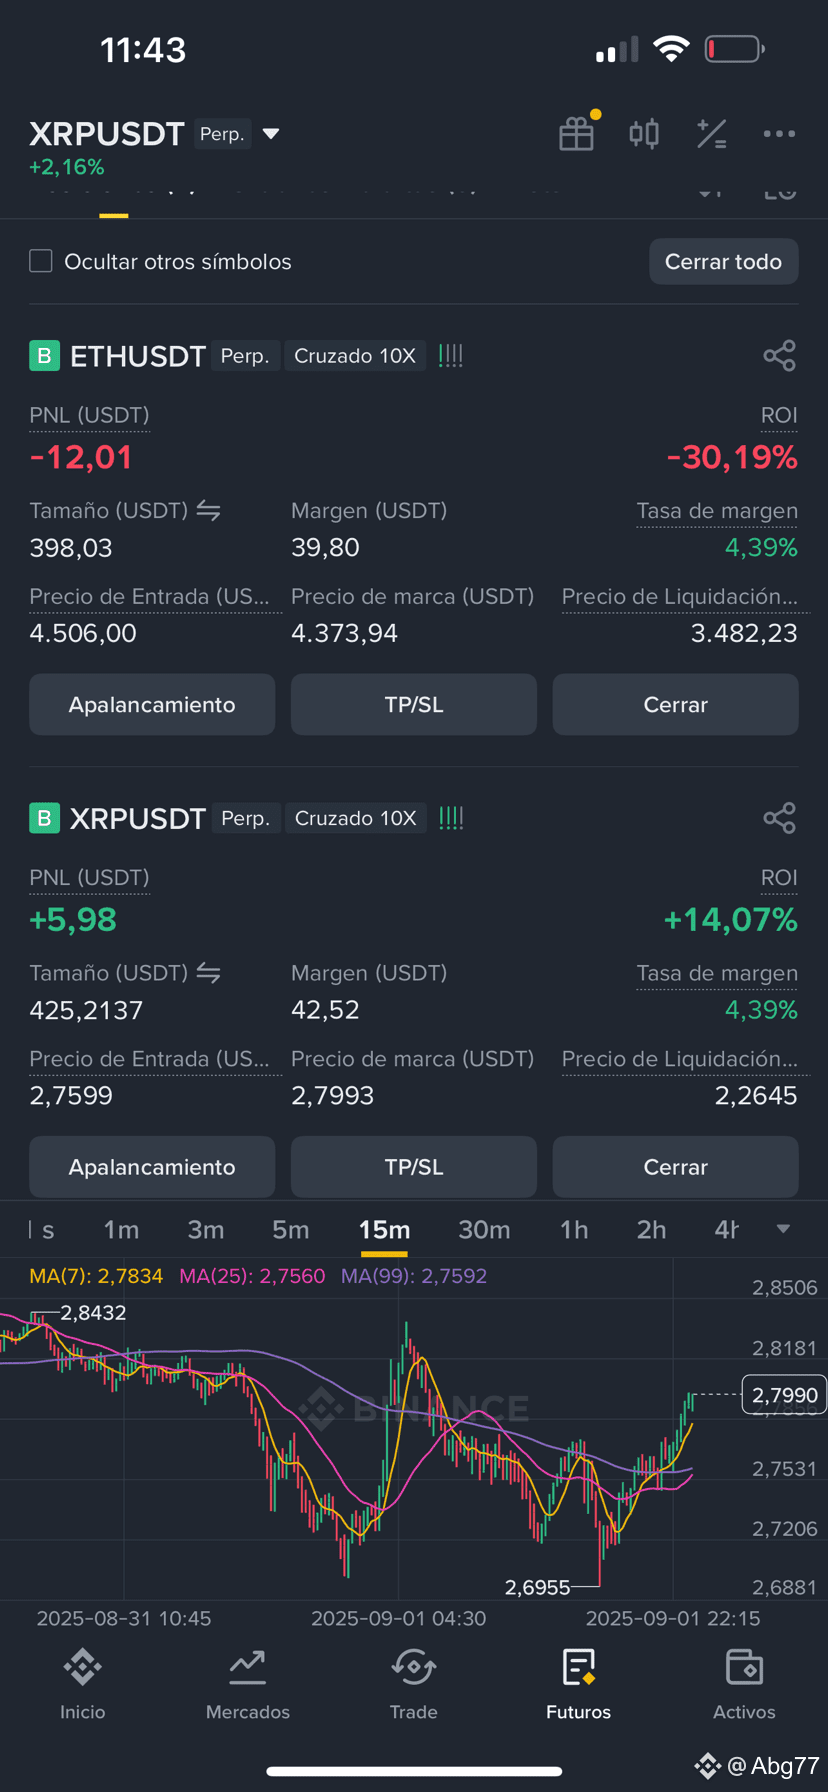
Hello everyone! I'm sharing a screenshot of my trades today so we can analyze the market together. I would like to know your opinion and, in the meantime, explain what I am seeing on the chart.
As you can see, I have two open trades:
* ETH/USDT: This trade is in loss (-12.01 USDT). The ETH market has moved against my position, and I am at -30.19% return.
* XRP/USDT: This trade is giving me profit (+5.98 USDT), with a return of +14.07%. Here the strategy seems to be working better!
What am I seeing on the XRP chart?
* Moving Averages (MA): On the 15-minute chart, the lines of the moving averages (MA7, MA25, MA99) are crossing. This is an important indicator for me. The price is approaching the MA99 (the purple line), which could indicate that there is resistance at that level.
* Candle Pattern: The price has bounced at $2.6955, which could be a sign of support. The bounce of the green candle gives me confidence that the trend could continue upwards, at least in the short term.
My prediction
I believe that XRP could have a bullish movement in the next few hours. I will monitor if it breaks the resistance level around MA99 to decide whether to hold the trade.
Now I want to know your opinion! What do you see in these charts? What do you think will happen with ETH and XRP in the next 24 hours? I look forward to your comments!#BinancehodlerSOMI #Xrp🔥🔥#ETH #BinancehodlerSOMI #USNonFarmPayrollReport #GoldPriceRecordHigh
Hello everyone! I'm sharing a screenshot of my trades today so we can analyze the market together. I would like to know your opinion and, in the meantime, explain what I am seeing on the chart.
As you can see, I have two open trades:
* ETH/USDT: This trade is in loss (-12.01 USDT). The ETH market has moved against my position, and I am at -30.19% return.
* XRP/USDT: This trade is giving me profit (+5.98 USDT), with a return of +14.07%. Here the strategy seems to be working better!
What am I seeing on the XRP chart?
* Moving Averages (MA): On the 15-minute chart, the lines of the moving averages (MA7, MA25, MA99) are crossing. This is an important indicator for me. The price is approaching the MA99 (the purple line), which could indicate that there is resistance at that level.
* Candle Pattern: The price has bounced at $2.6955, which could be a sign of support. The bounce of the green candle gives me confidence that the trend could continue upwards, at least in the short term.
My prediction
I believe that XRP could have a bullish movement in the next few hours. I will monitor if it breaks the resistance level around MA99 to decide whether to hold the trade.
Now I want to know your opinion! What do you see in these charts? What do you think will happen with ETH and XRP in the next 24 hours? I look forward to your comments!#BinancehodlerSOMI #Xrp🔥🔥#ETH #BinancehodlerSOMI #USNonFarmPayrollReport #GoldPriceRecordHigh