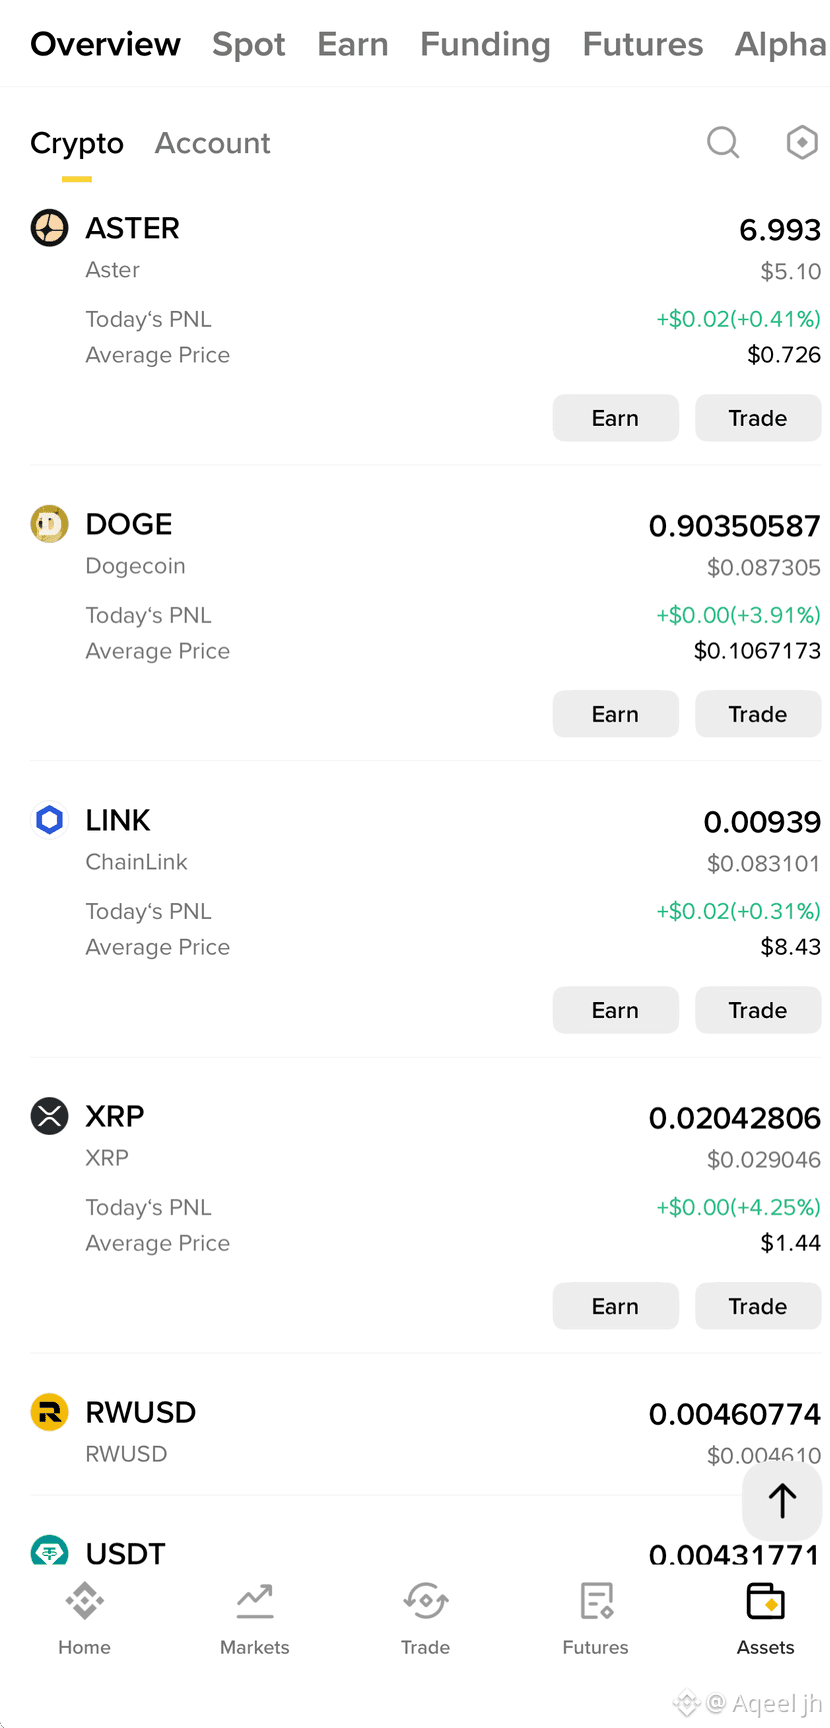
It looks like you're tracking your portfolio on an exchange interface. Based on the image, you have a variety of holdings ranging from ecosystem tokens like ASTER to established majors like DOGE, LINK, and XRP.
Here is a breakdown of what your current "Overview" is telling you:
📊 Portfolio Snapshot
Your dashboard highlights a few key metrics for each asset:
• Amount Owned: The large number at the top right of each section (e.g., you hold 6.993 ASTER).
• Total Value: The smaller USD amount below the holding (e.g., your ASTER is worth $5.10).
• Average Price: This is your "break-even" point. For example, your average buy for XRP is $1.44, but the current market price shown in the small text is significantly lower ($0.029).
Here is a breakdown of what your current "Overview" is telling you:
📊 Portfolio Snapshot
Your dashboard highlights a few key metrics for each asset:
• Amount Owned: The large number at the top right of each section (e.g., you hold 6.993 ASTER).
• Total Value: The smaller USD amount below the holding (e.g., your ASTER is worth $5.10).
• Average Price: This is your "break-even" point. For example, your average buy for XRP is $1.44, but the current market price shown in the small text is significantly lower ($0.029).