
BitMine Immersion Technologies is entering a high-risk phase as paper losses from its Ethereum holdings continue to rise. The stock has not maintained its recent recovery, while both technical signals and cryptocurrency-related signals indicate that confidence is weakening.
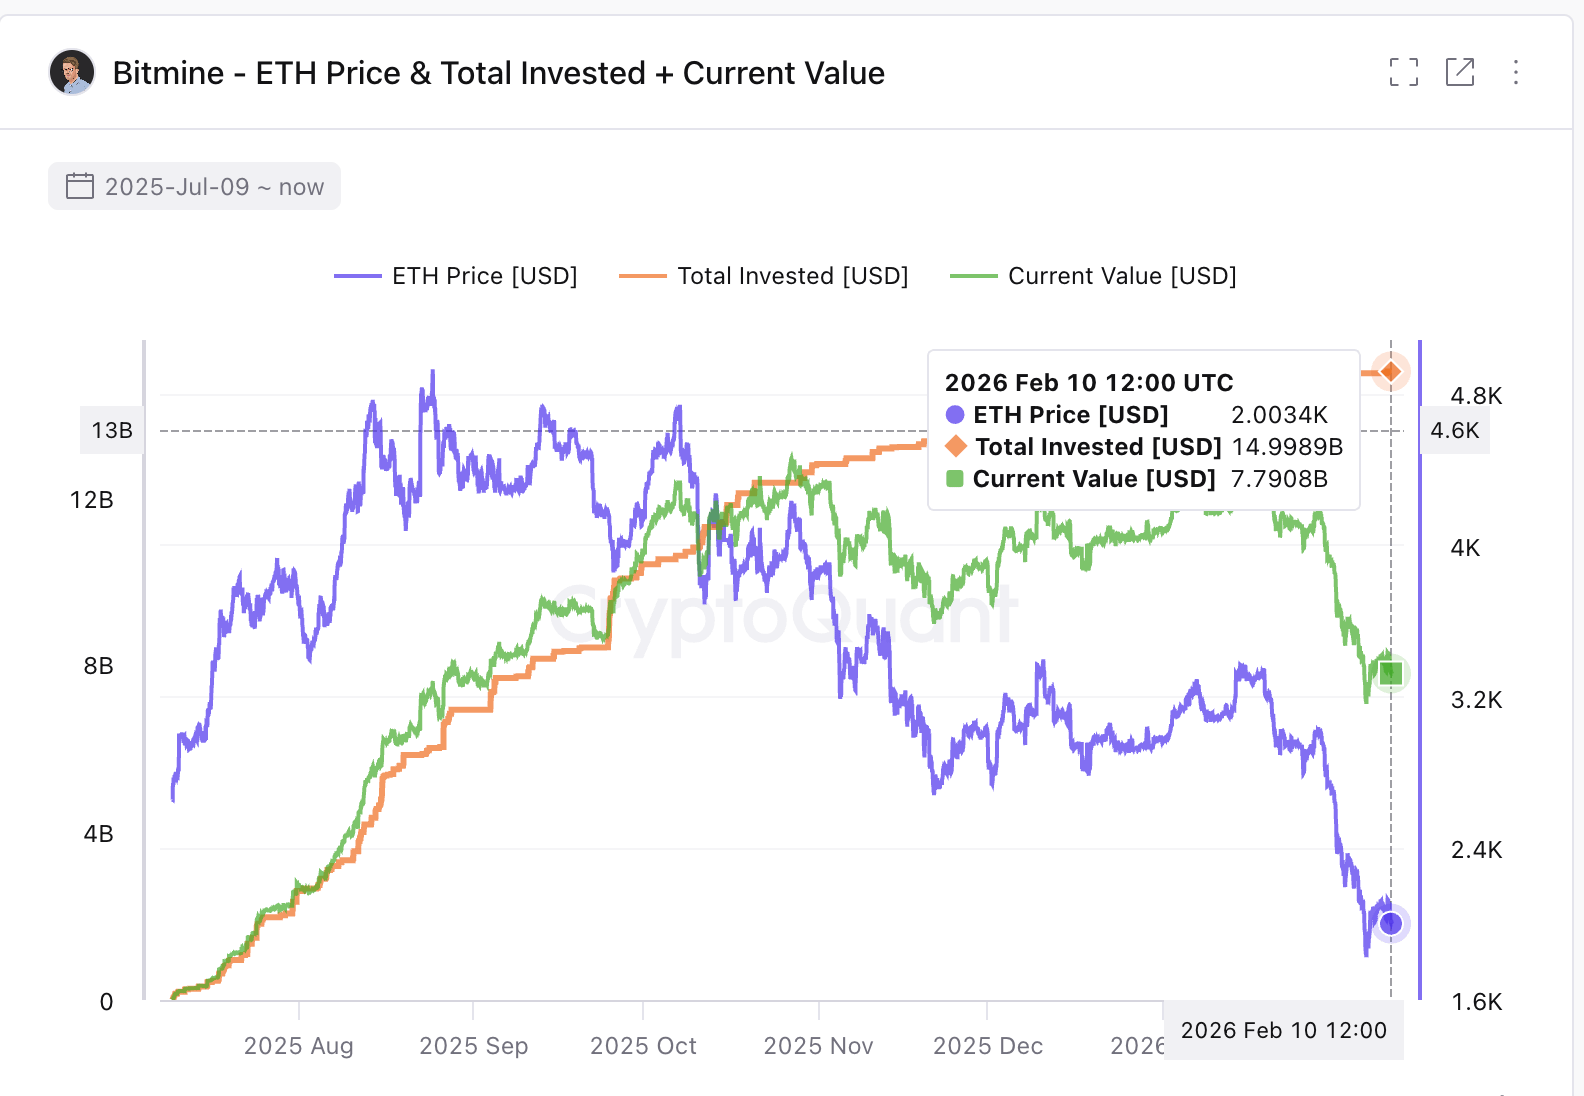
As of February 10, the total investment capital of BitMine has reached nearly 15 billion dollars. The current portfolio value of the company has decreased to about 7.7 billion dollars.
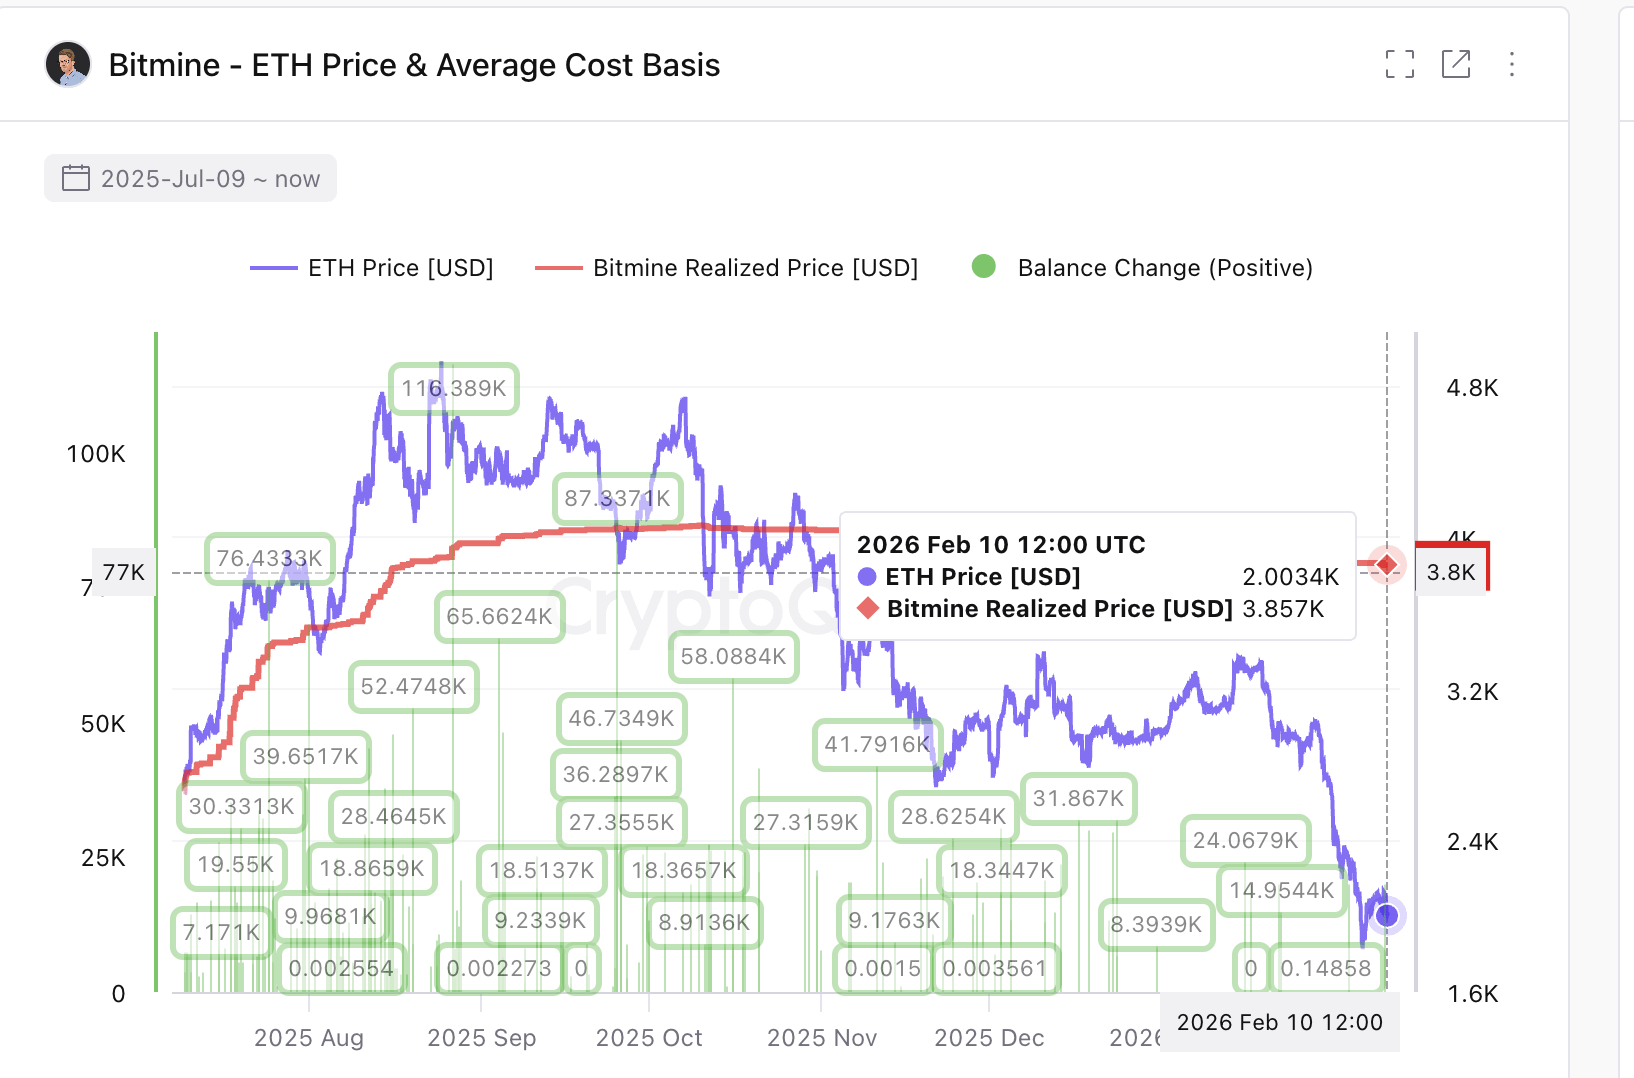
This means that, theoretically, nearly 49% of the investment value has been wiped out. At the same time, Ethereum is trading at around $1,950, while BitMine's actual cost was around $3,850. With ETH trading nearly 50% lower than the average purchase price, most investments are incurring significant losses.
Losses Based on Cost and Potential Divergence Signal Increased Selling Pressure
BitMine's biggest weakness is its ever-shrinking margin of safety. The actual price shows where the company has accumulated most of its Ethereum. When the market price remains significantly lower than this, companies will be under pressure to reduce their Ethereum holdings.
Current data shows that:
Average cost of ETH: $3,850
Current ETH price: $1,950
Unrealized loss: 49%
This puts BitMine in a vulnerable position. Technical signals further reinforce this risk.
From November 18th to February 9th, the BMNR index formed lower highs on the daily chart, while the RSI index formed higher highs. The RSI tracks momentum by measuring buying and selling strength.
When price forms lower highs and the RSI forms higher highs, this creates an underlying bearish divergence. This indicates that momentum is weakening beneath the surface.
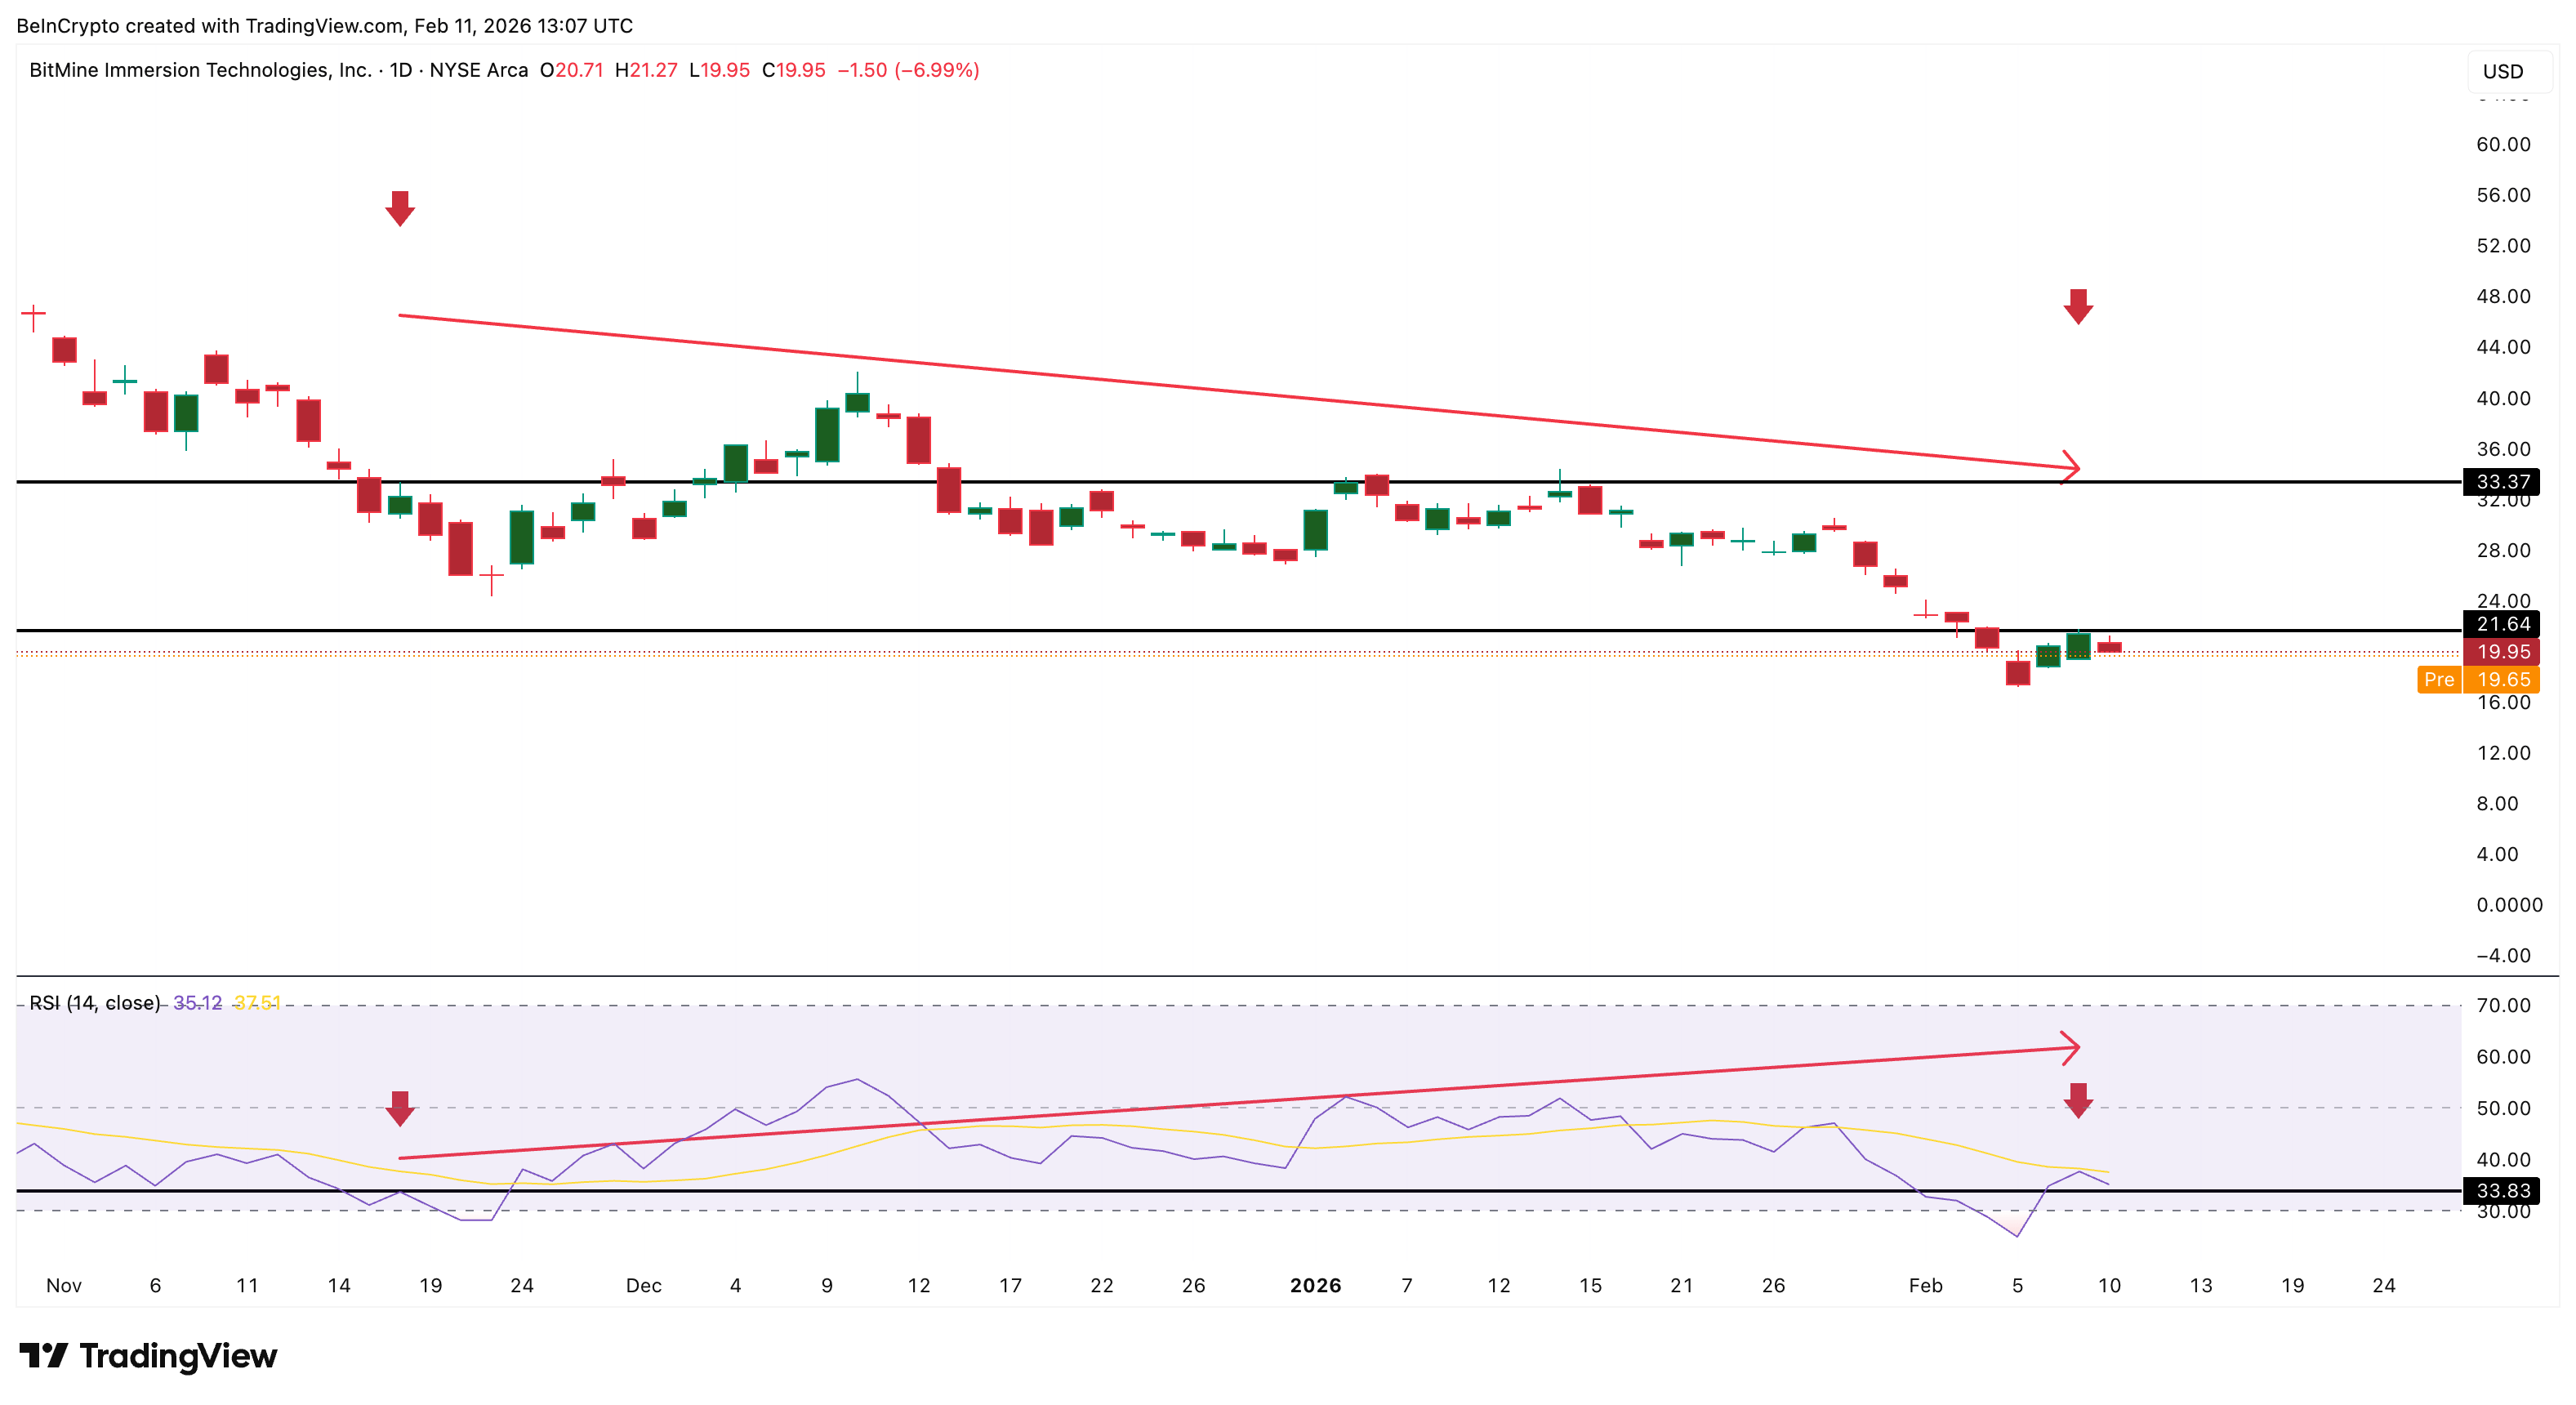
Immediately after this divergence appeared, selling pressure resumed. The BMNR index recovered nearly 26% from its January lows. However, the upward momentum could not be sustained and is now at risk of a downward correction due to the divergence and increasing pressure from cost basis spreads.
Weak cash flow and intersecting risks suggest declining confidence.
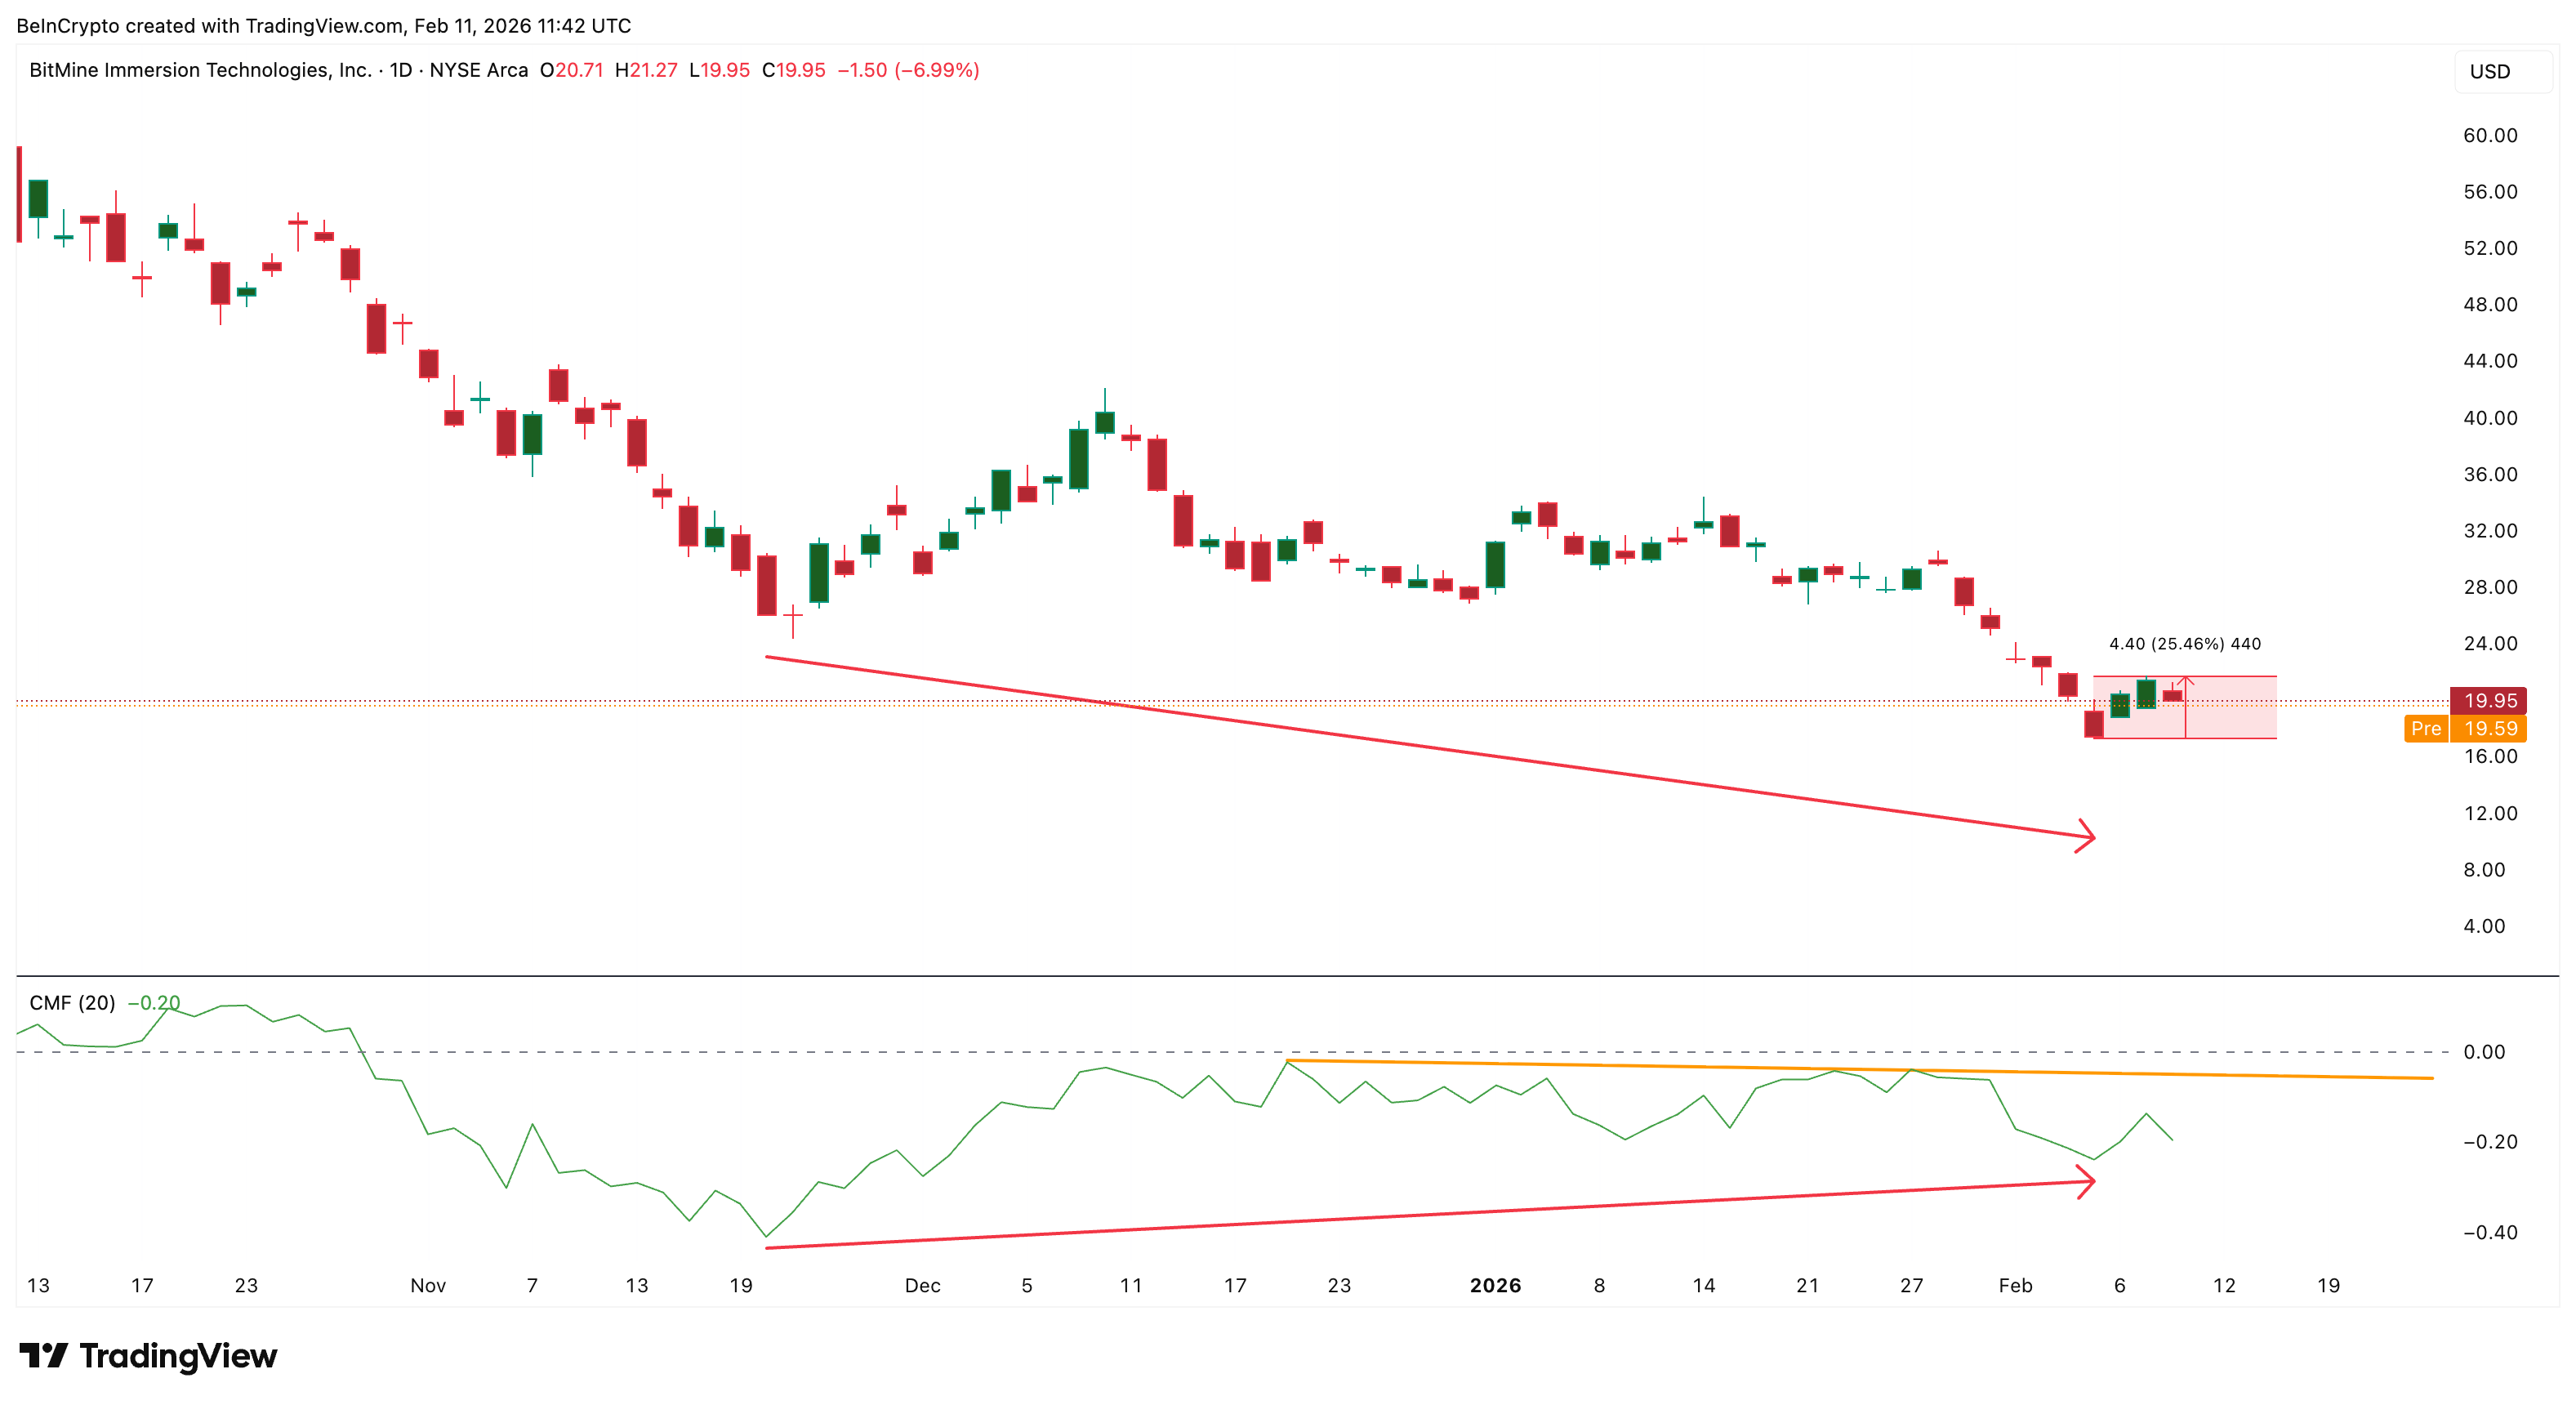
Large capital flows are beginning to show signs of hesitation. The Chaikin Money Flow (CMF) index tracks whether large investors are accumulating or distributing. A value above 0 typically signals buying, while a value below 0 indicates selling pressure.
From late November to early February, CMF trended upward despite price declines. This suggests some long-term support, and that support remains. But even during the recent 26% rebound, CMF failed to break above the descending trend line.
It also failed to create new highs and didn't even break through the zero line. This means the rally lacked strong support from large investors, and the current trend still leans towards a large investor withdrawal.
Moving averages offer another warning. The 100-day exponential moving average (EMA) is currently approaching the 200-day EMA. Exponential moving averages (EMAs) place more emphasis on the value of recent trades, making them very useful in detecting trend changes early.
When short-term moving averages fall below long-term moving averages, it usually signals deeper weakness. Previously, on January 27th, a bearish (death) crossover signal occurred when the 50-day EMA fell below the 200-day EMA. Following that signal, BMNR dropped by over 44%.
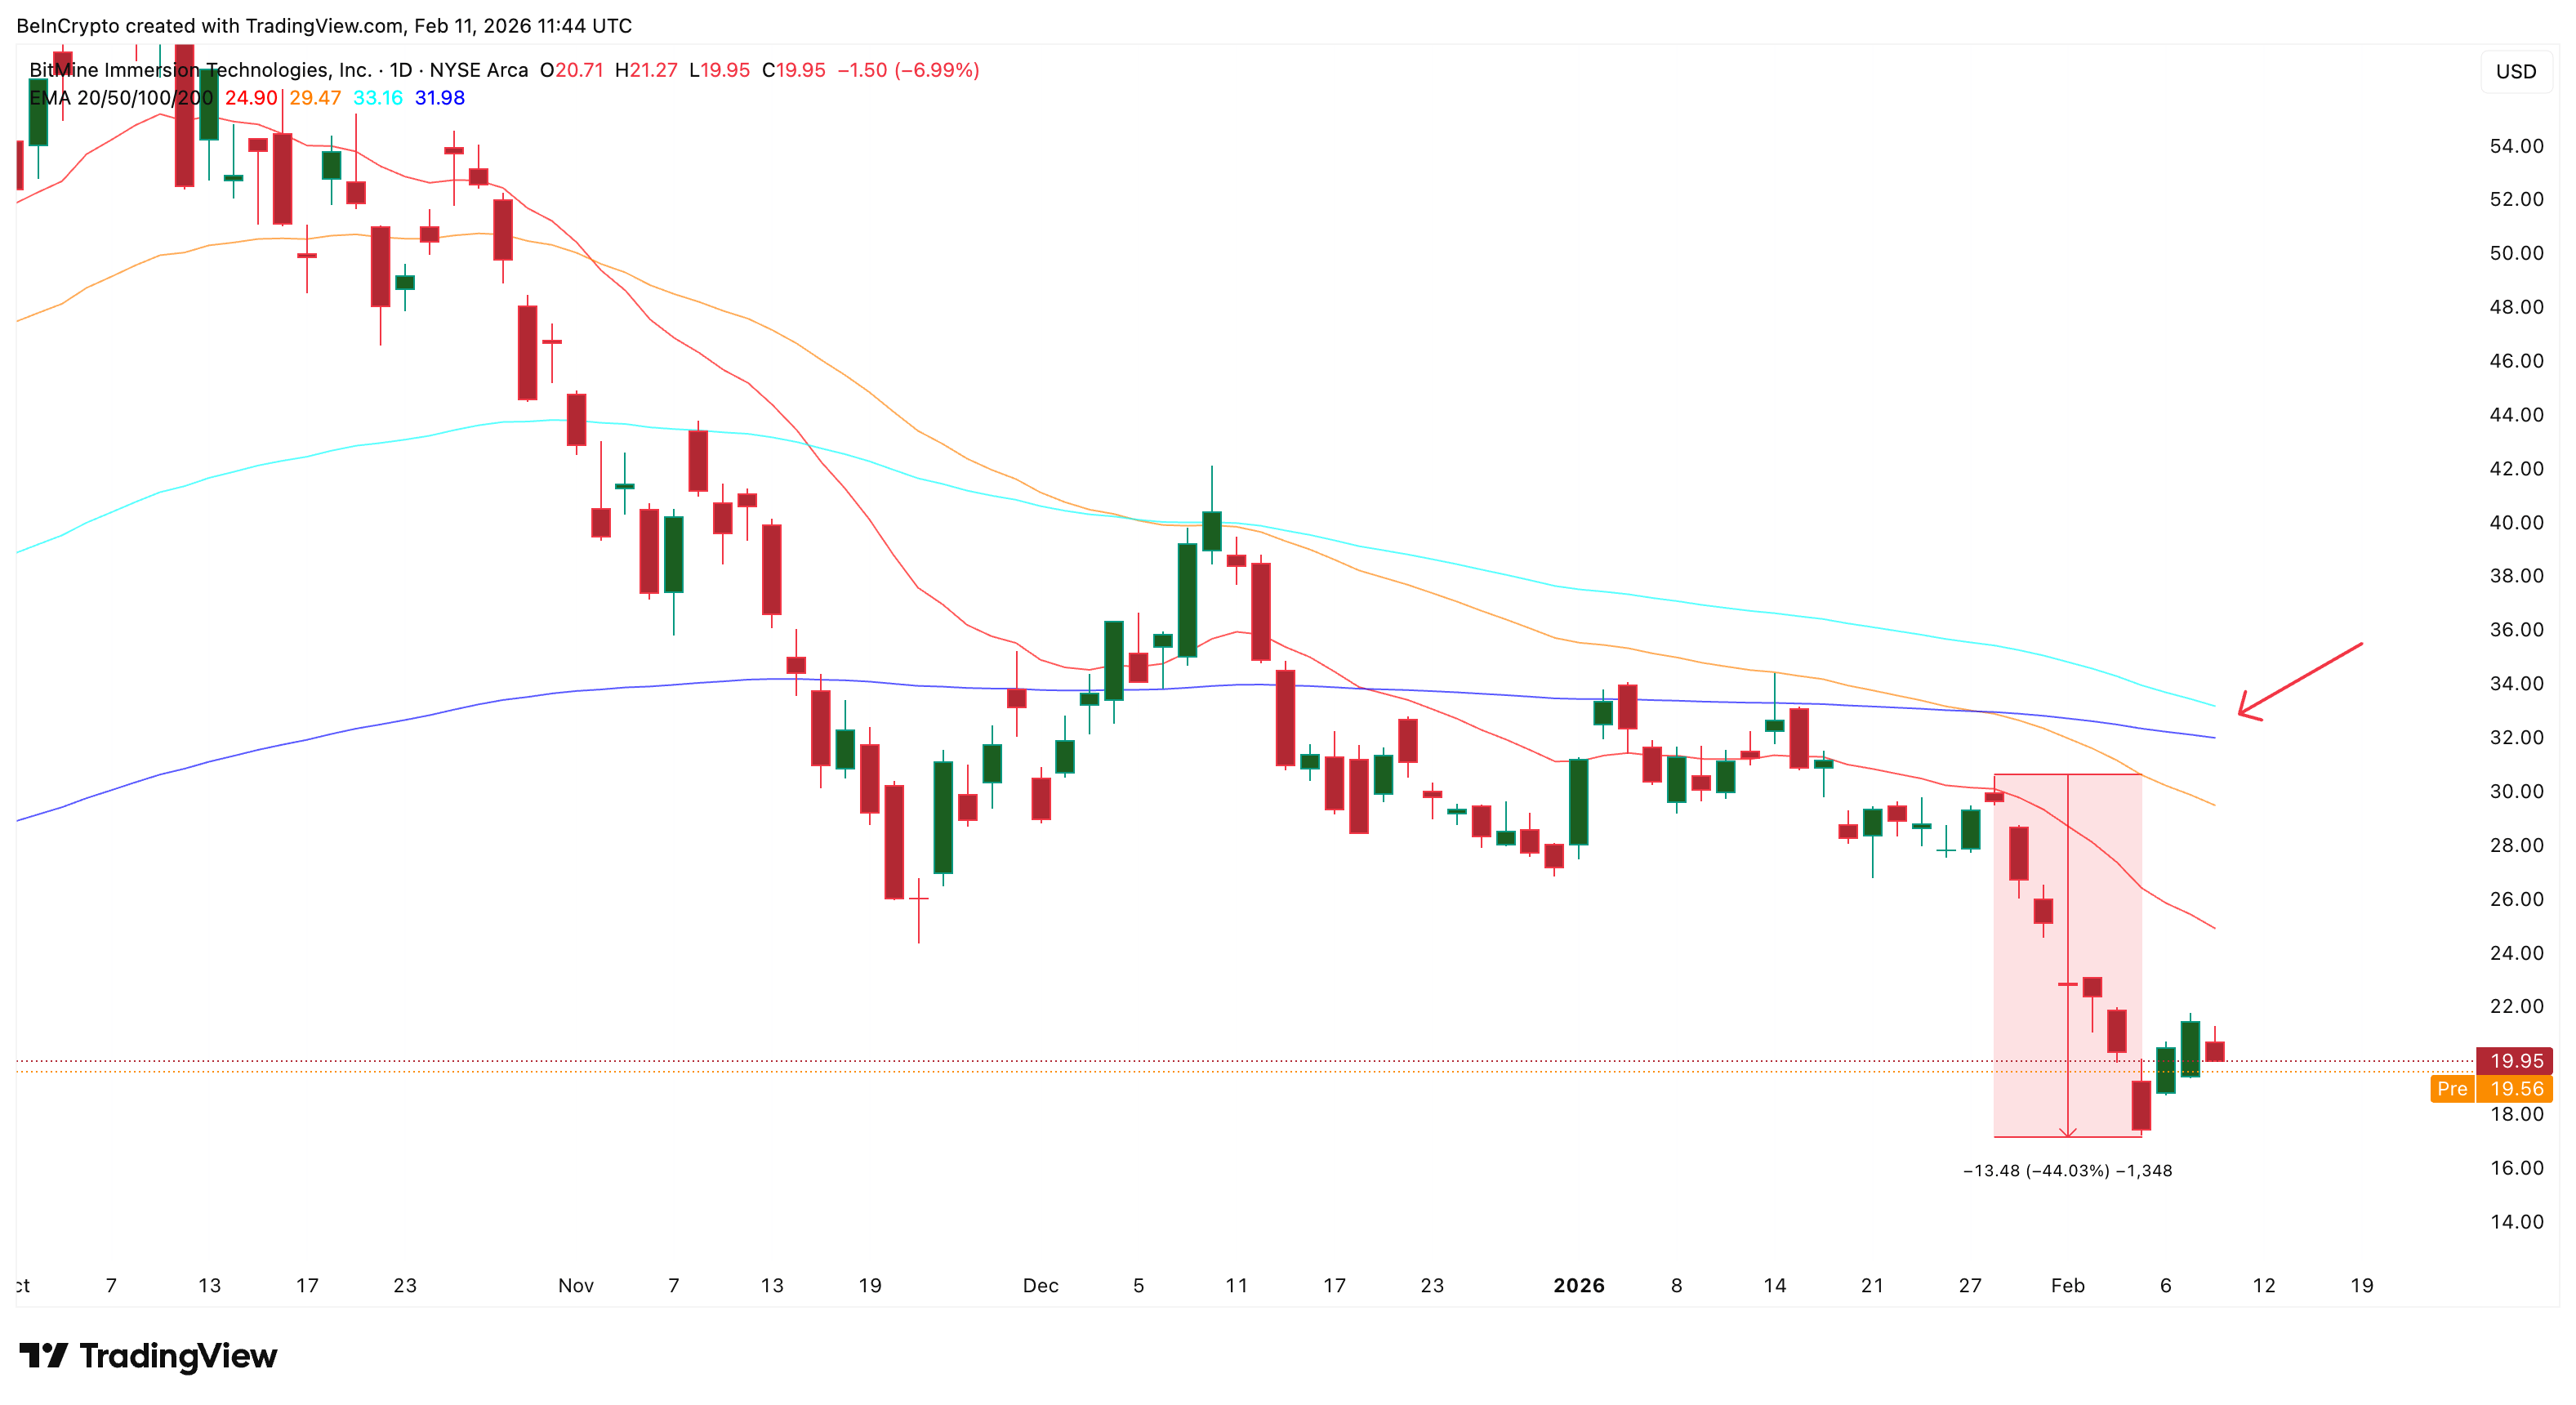
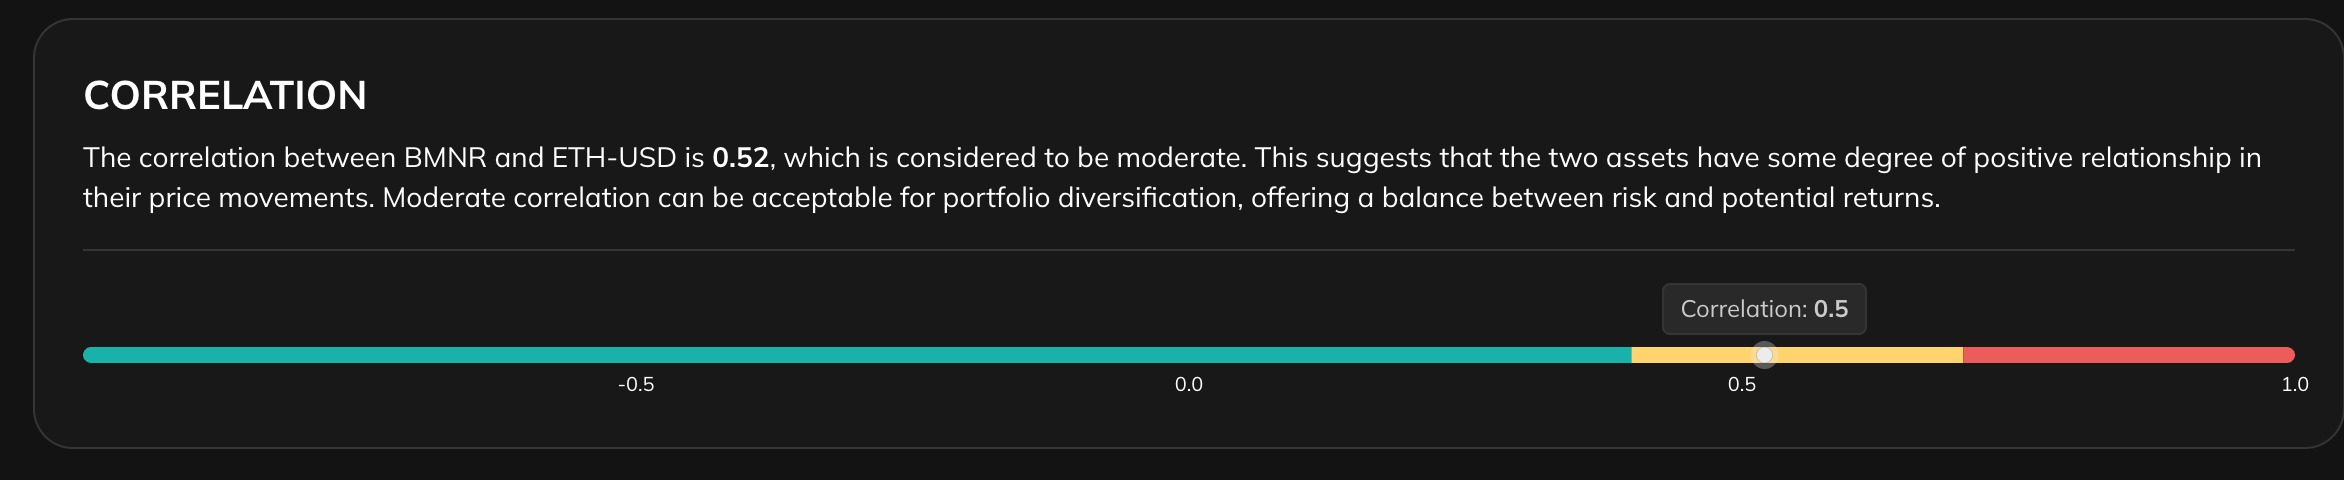
If another bearish crossover signal appears, downward pressure could increase, even if it's not as strong as a death crossover. This risk is further increased if Ethereum continues to weaken. The BMNR indicator still shows a moderate correlation with ETH at around 0.5.
The continued weakening of ETH could directly impact stock prices.
Key Price Levels for BitMine Stock Indicate the Beginning of the Next Downtrend
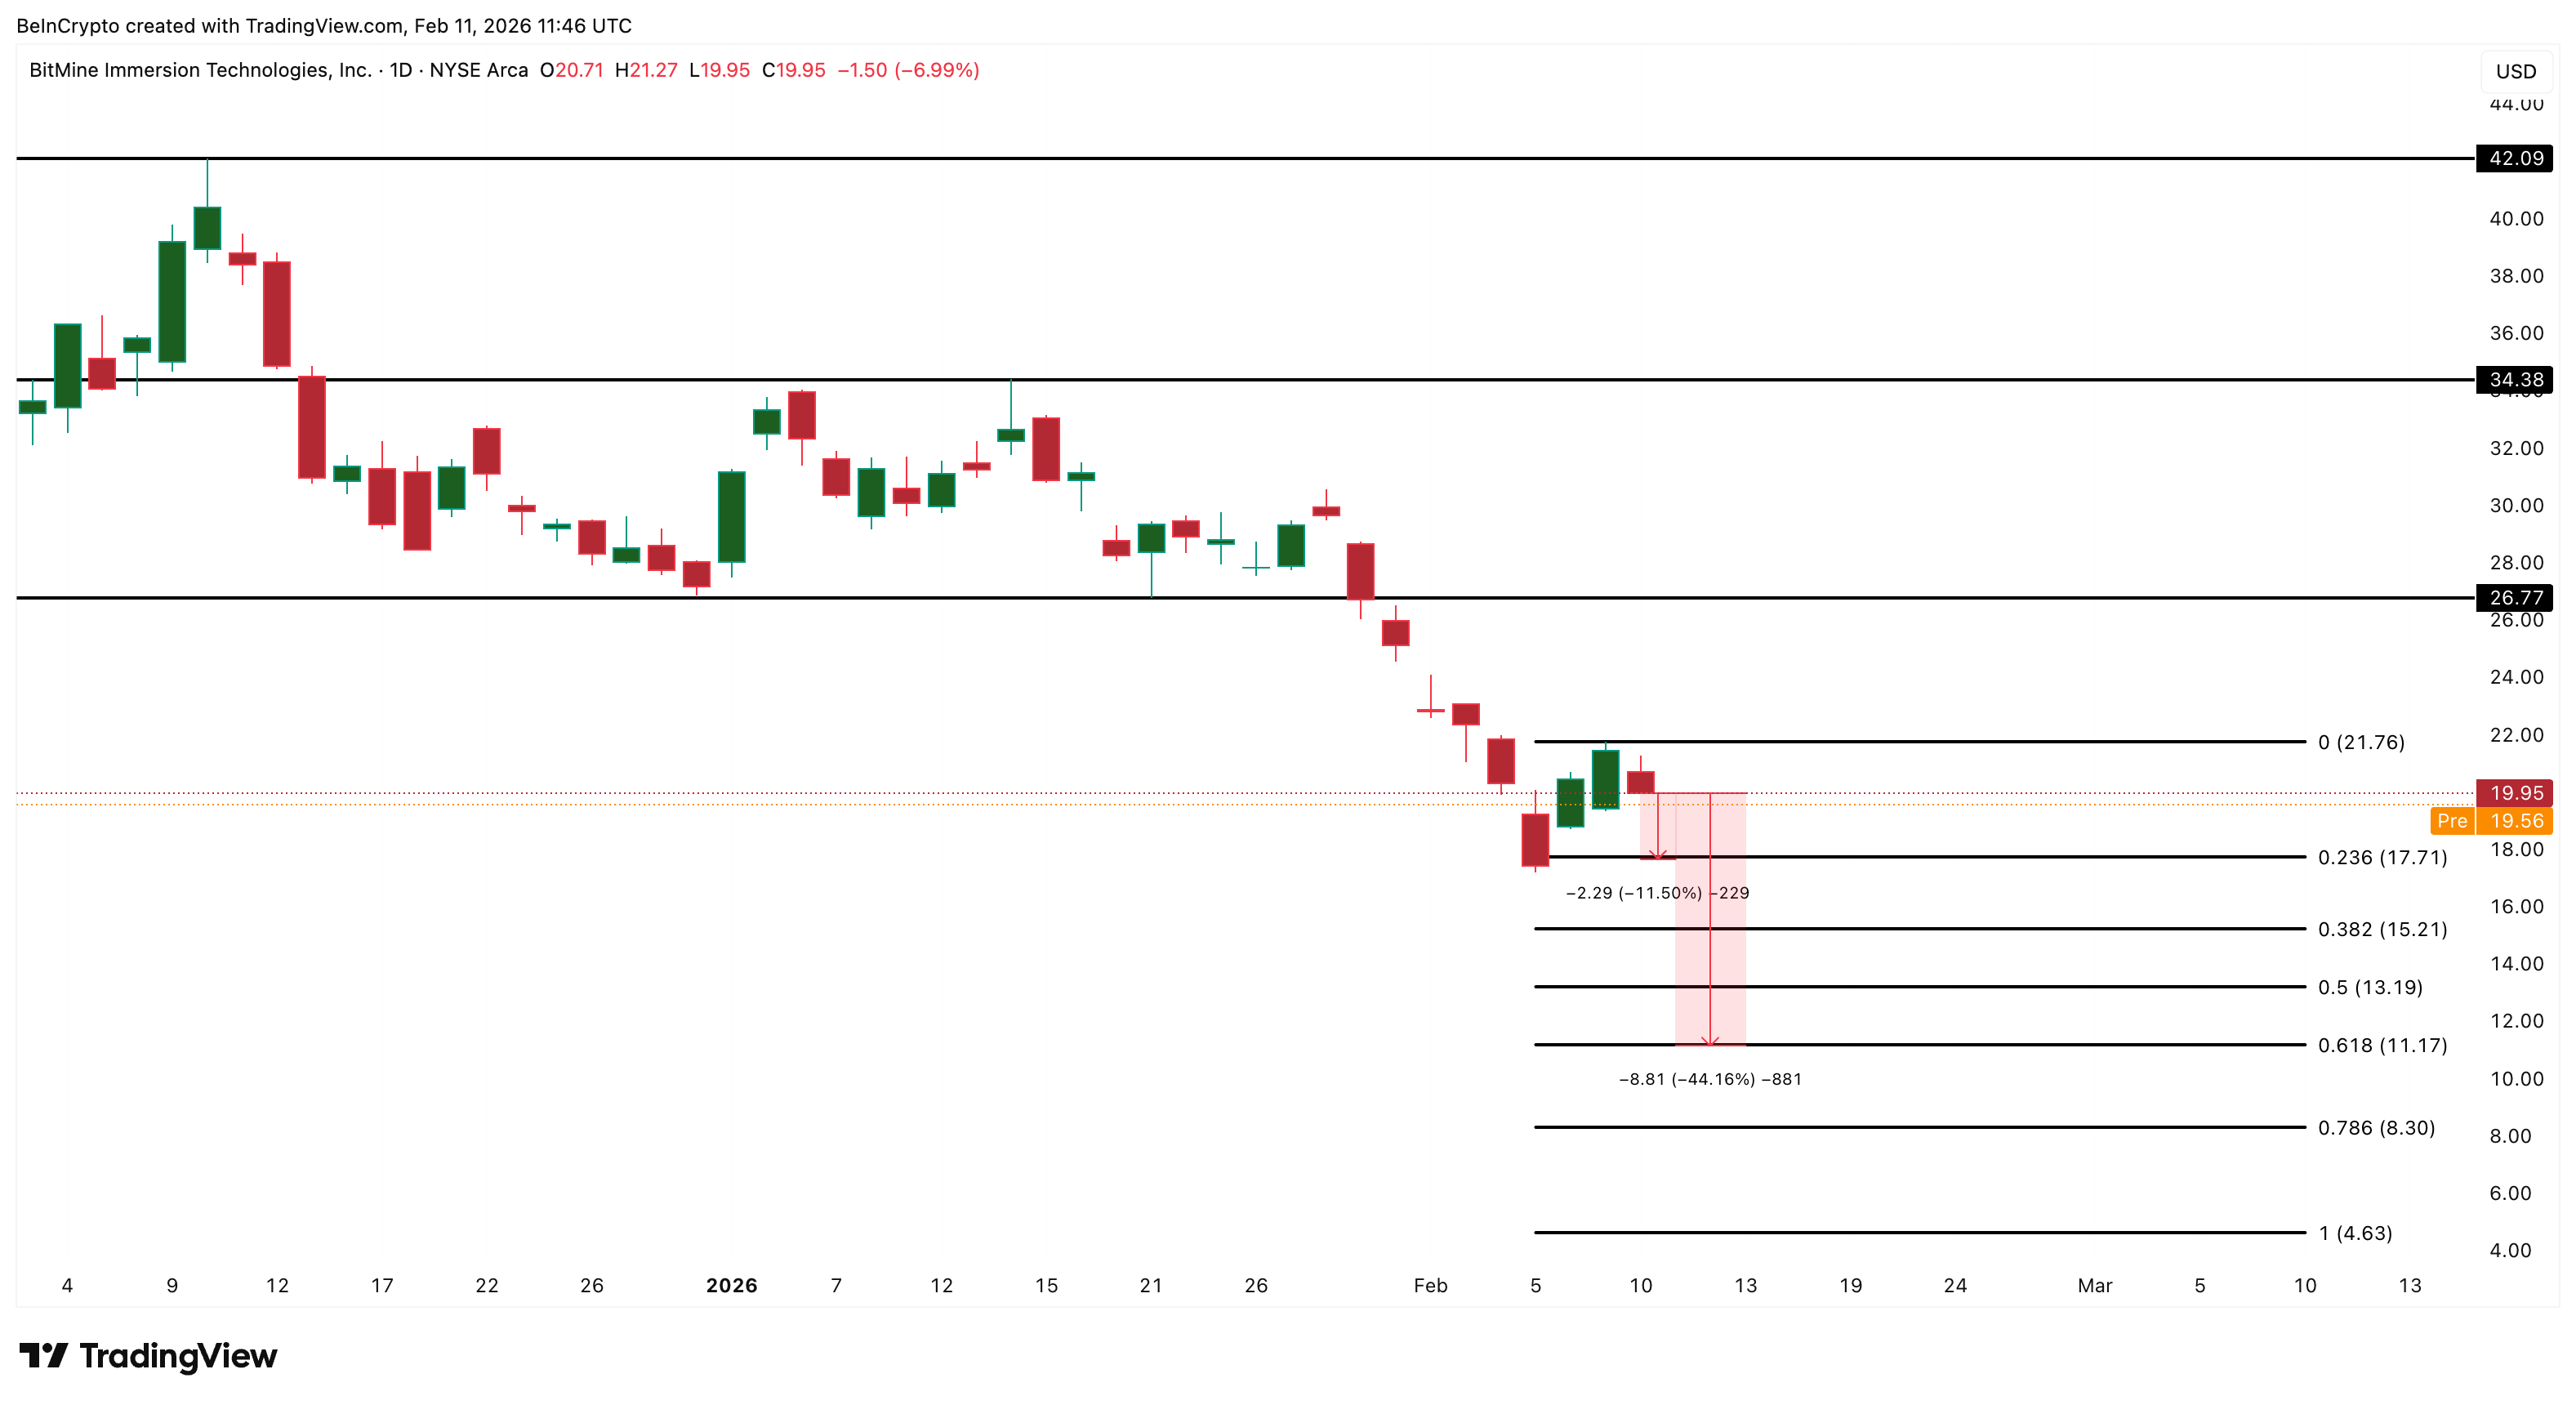
With losses based on cost basis increasing, BitMine's stock price structure is now becoming very important. The most important short-term support level is around $17, just over 10% away from the current level. This level has acted as a support threshold during the recent correction.
If BMNR loses $17, the downward momentum could intensify.
Below this area, the next support level appears near $15. If this level fails, the Fibonacci forecast points to $11, marking the 0.618 retracement level, a historically strong level. A move towards $11 would represent a further decline of more than 40% from the current level.
However, overall, the recovery process remains challenging. BitMine's stock price needs to break above $21 to alleviate immediate pressure. This level coincides with previous resistance.
Only when the price surpasses $21 will the short-term structure begin to improve. To continue rising to $26, stronger Ethereum pricing and greater capital inflows are needed. Currently, both of these factors are uncertain. As long as ETH continues to trade significantly below BitMine's cost basis and cash flow remains weak, rallies are likely to face strong selling pressure.
