Hello everyone! I want to share this trading chart so that we can learn to understand it better together. Don't be scared, it's simpler than it seems.
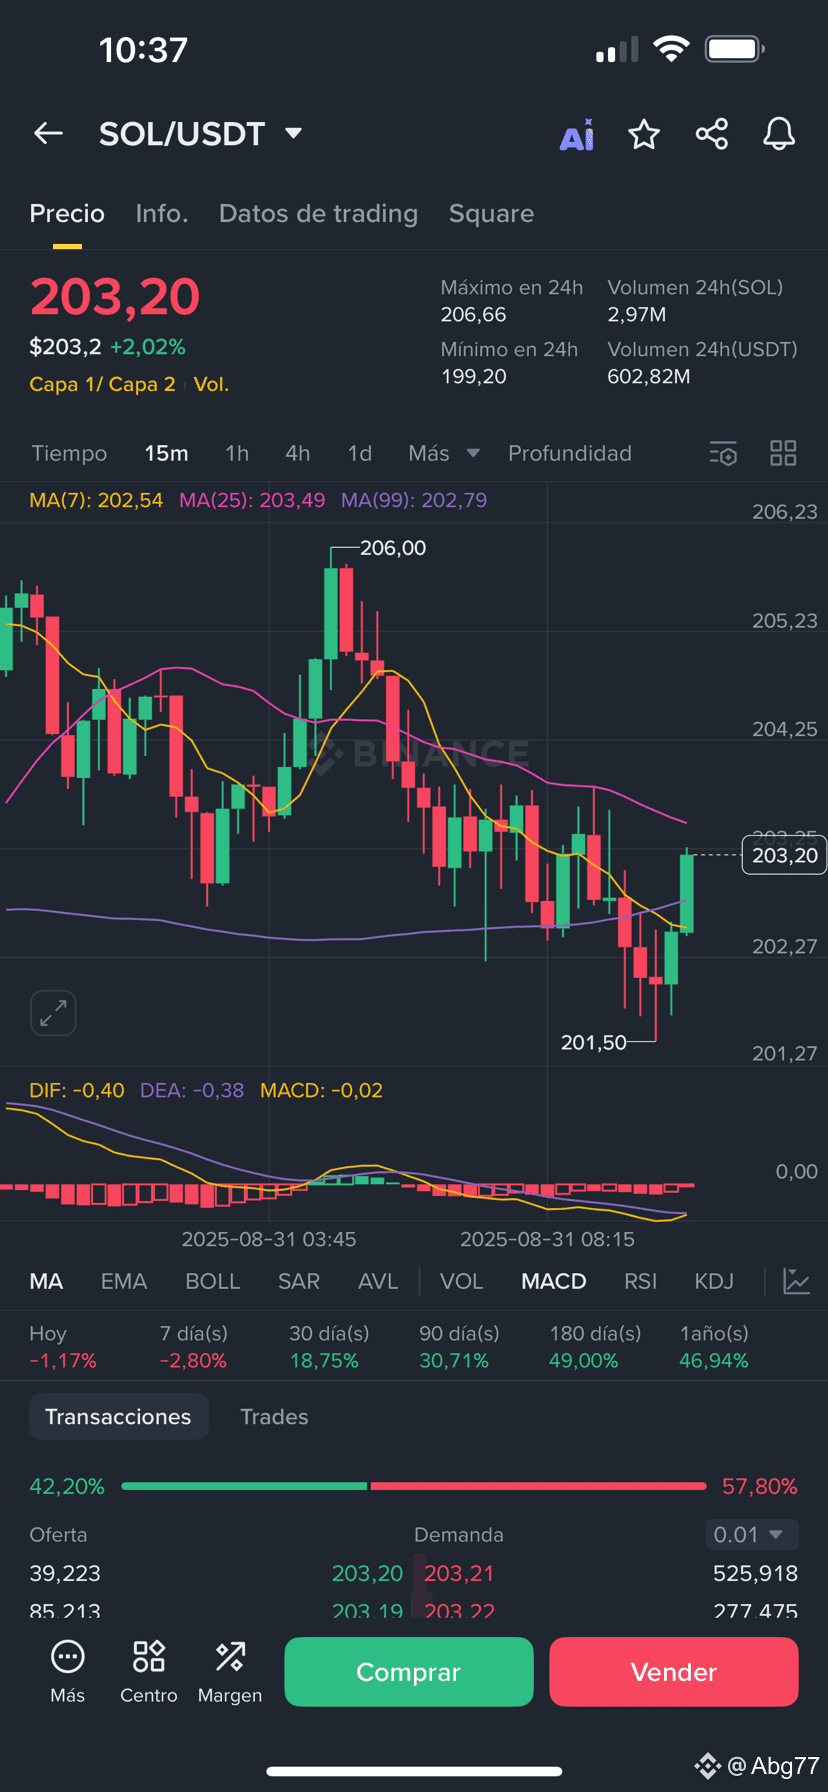
This SOL/USDT chart shows us the price of the cryptocurrency Solana (SOL) against the US dollar (USDT) over a period of 1 hour.
What can we see here?
* Red and green candles: They are like small bars that tell us what happened to the price. Green candles mean that the price went up during that time period, while red candles show us that the price went down.
* Current price: Right now, the price of SOL is at 203.20 USDT. The moving line is the real-time price.
* Colored lines (MA): The yellow and purple lines are the Moving Averages (MA). They are an indicator that helps us see the price trend. For example, if the price remains above these lines, it may be a signal of an upward trend.
* MACD: At the bottom, the MACD indicator is another tool that traders use to identify possible changes in the direction of the price.
My goal with this is to demystify trading and show that with a little knowledge, anyone can start to understand these charts.
Feel free to ask questions! Leave any doubts you have in the comments, no matter how simple they may seem. What would you like to learn about chart analysis?
#MarketPullback #SaylorBTCPurchase #BinanceHODLerMITO #SOLTreasuryFundraising $SOL
This SOL/USDT chart shows us the price of the cryptocurrency Solana (SOL) against the US dollar (USDT) over a period of 1 hour.
What can we see here?
* Red and green candles: They are like small bars that tell us what happened to the price. Green candles mean that the price went up during that time period, while red candles show us that the price went down.
* Current price: Right now, the price of SOL is at 203.20 USDT. The moving line is the real-time price.
* Colored lines (MA): The yellow and purple lines are the Moving Averages (MA). They are an indicator that helps us see the price trend. For example, if the price remains above these lines, it may be a signal of an upward trend.
* MACD: At the bottom, the MACD indicator is another tool that traders use to identify possible changes in the direction of the price.
My goal with this is to demystify trading and show that with a little knowledge, anyone can start to understand these charts.
Feel free to ask questions! Leave any doubts you have in the comments, no matter how simple they may seem. What would you like to learn about chart analysis?
#MarketPullback #SaylorBTCPurchase #BinanceHODLerMITO #SOLTreasuryFundraising $SOL