Meow Uncle researched the latest weekend reports from numerous institutions and summarized their judgments on the position of BTC's deep bear bottom. Here are the conclusions:
First, after the big drop from 126K to 60K, the rebound has realized a historical peak loss of 2 billion dollars. Then there is a unanimous conclusion from multiple institutions: the market has a demand for a rebound in the short term, but it has not yet reached the true deep bear bottom zone of the crypto world.
Their analysis mainly focuses on four major data dimensions:
Classic indicators (NUPL, MVRV, SOPR, etc.) show that we have not yet entered the deep bear zone (historical bottom corresponds to the 55k-40k range), but the increase in network activity is a positive signal
The long and short positions have decreased by 10-14%, leverage has been cleaned but has not reached an extreme; spot trading volume has surged showing turnover, but active buying is insufficient
Capital flow: Stablecoins and ETFs continue to flow out, the speed has slowed but lacks clear entry catalysts
Options market trends: Volatility has surged to 90, the term structure inverted to 1.30 (historical turning point signal), but negative skew shows severe hedging sentiment
Summary of resistance levels given by institutions:
74k (previous low trapped area)
79-80k (real average price)
91.5k (short-term holding cost line)
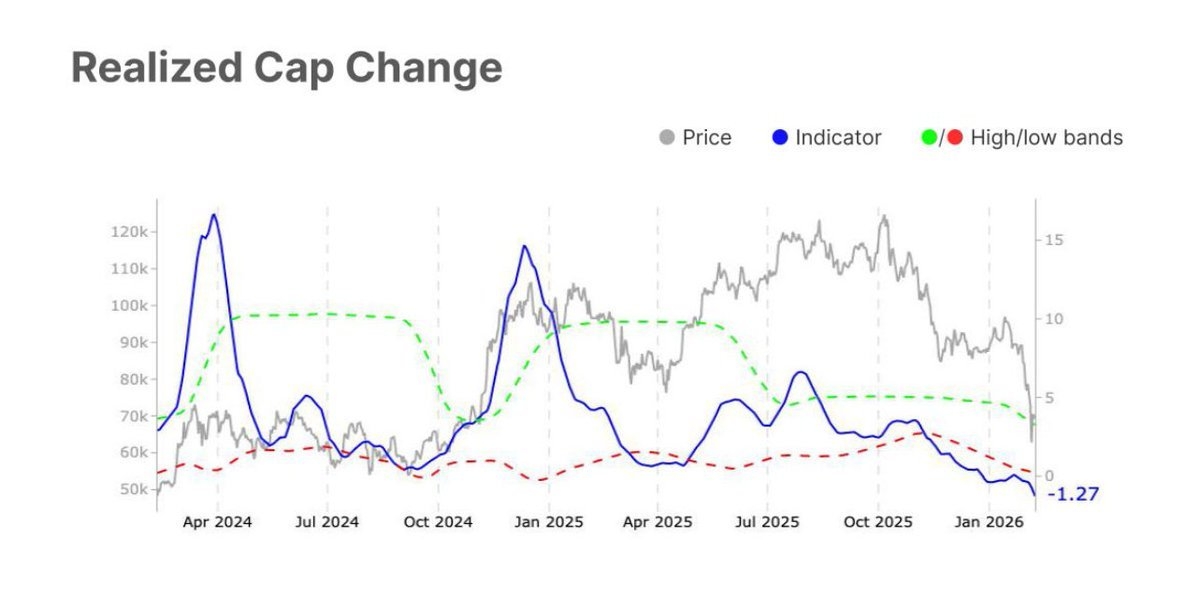
Realized market cap changes
Currently further falling into negative value range, down 236%, indicating capital is flowing out, showing seller dominance.
Profit supply ratio
Dropped to 55%, meaning nearly half of BTC is in a loss state, a large number of chips 'trapped' is a typical feature of the bottom area. Historically, when the profit supply ratio drops below 50%, it often approaches the cycle bottom
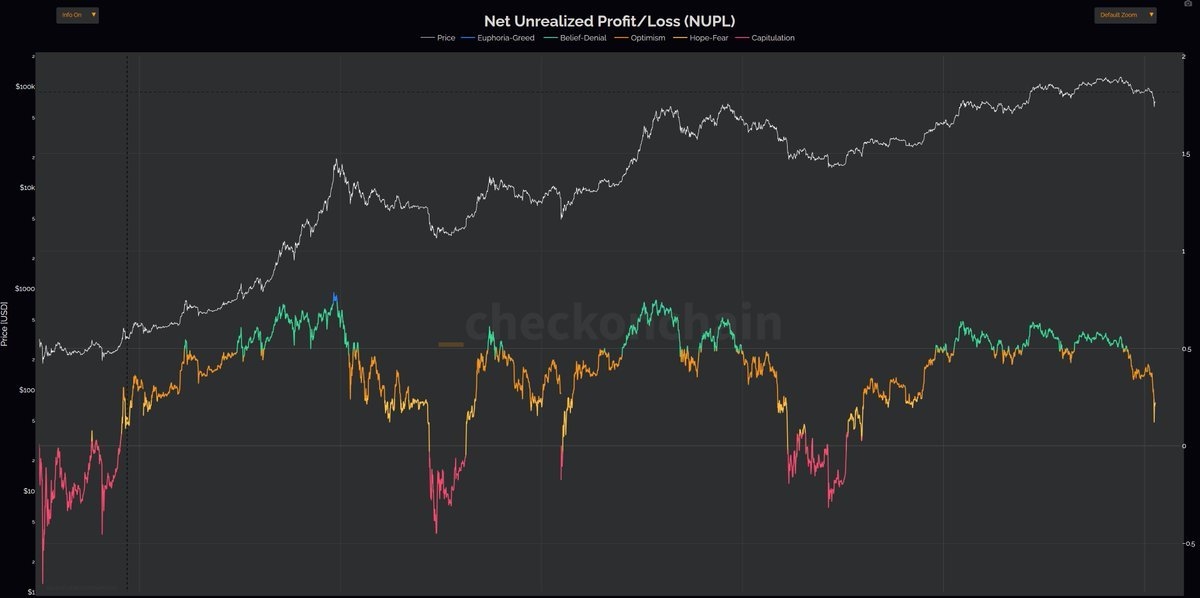
NUPL
Net unrealized losses have increased significantly. In historical cycles, when NUPL enters the extremely negative area (red area), it often marks the cyclical bottom. Now still in the yellow area... not yet in the truly deep bear zone.
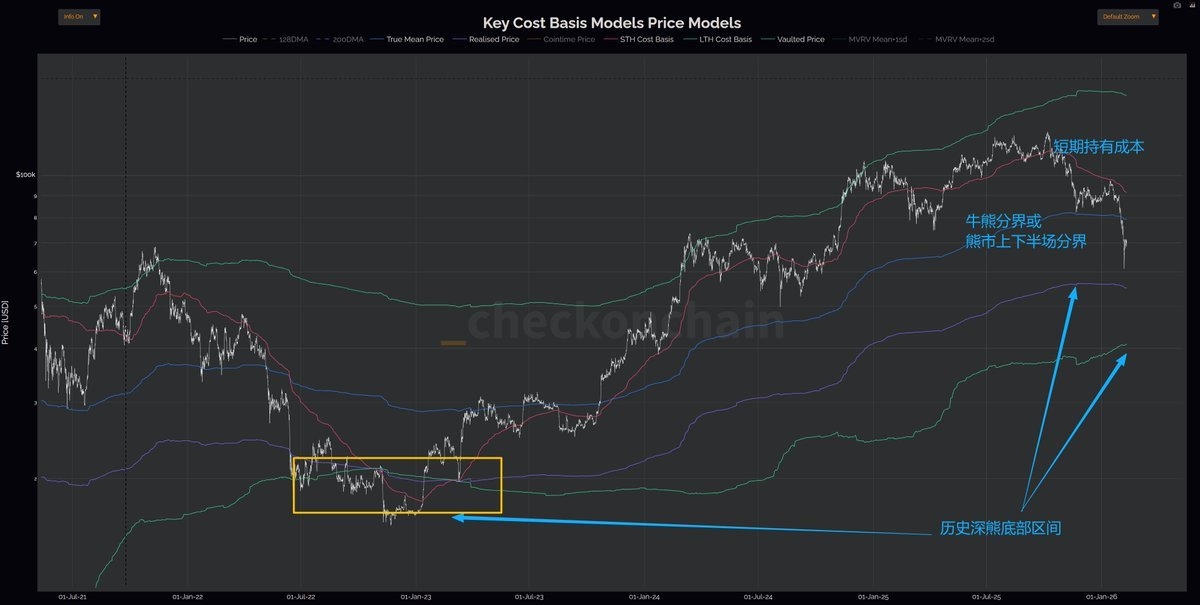
On-chain price model
The red line is the cost of short-term holders.
Blue line real average price can be seen as the boundary between bull and bear or the boundary between the upper and lower halves of a bear market
Purple line realized price and green line average cost for long-term holders
This is the area of deep bears in historical cycles (corresponding to the current 55k and 40k)
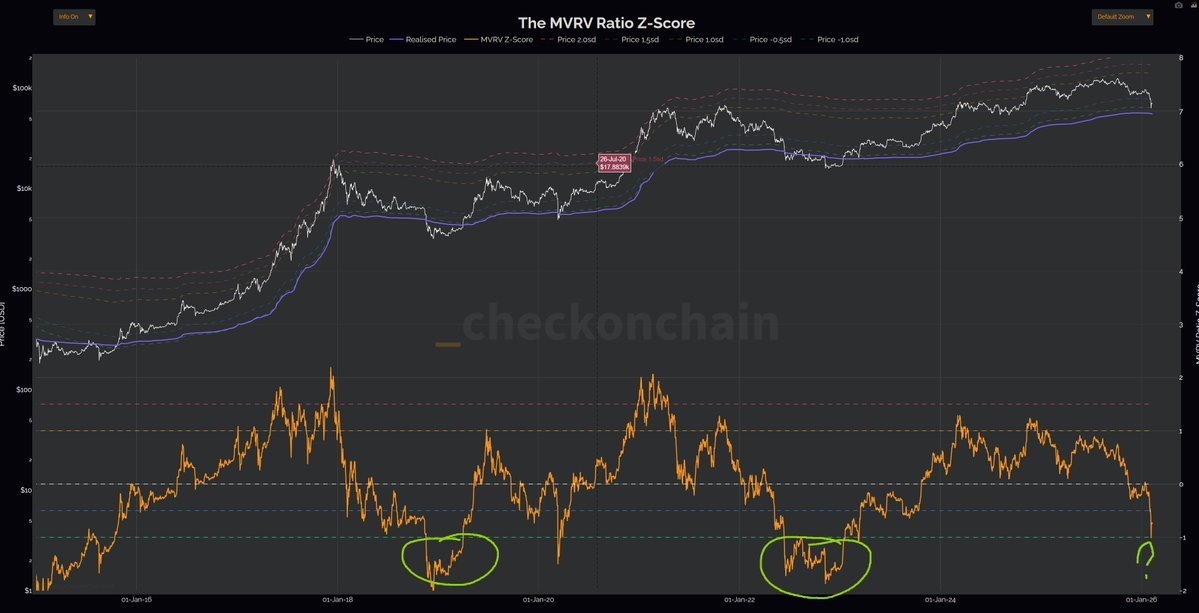
MVRV Z-Score
One of the most famous and effective 'bottom fishing and peak escaping' indicators in on-chain data
Red zone escape peak, green zone bottom fishing.
Historical deep bears have reached below the green zone twice. This wave just touched the green zone
(By the way, this round's peak hasn't even touched the red zone)
So will this wave wait until below the green, or will it 'rush out' like it hasn't reached the red zone?
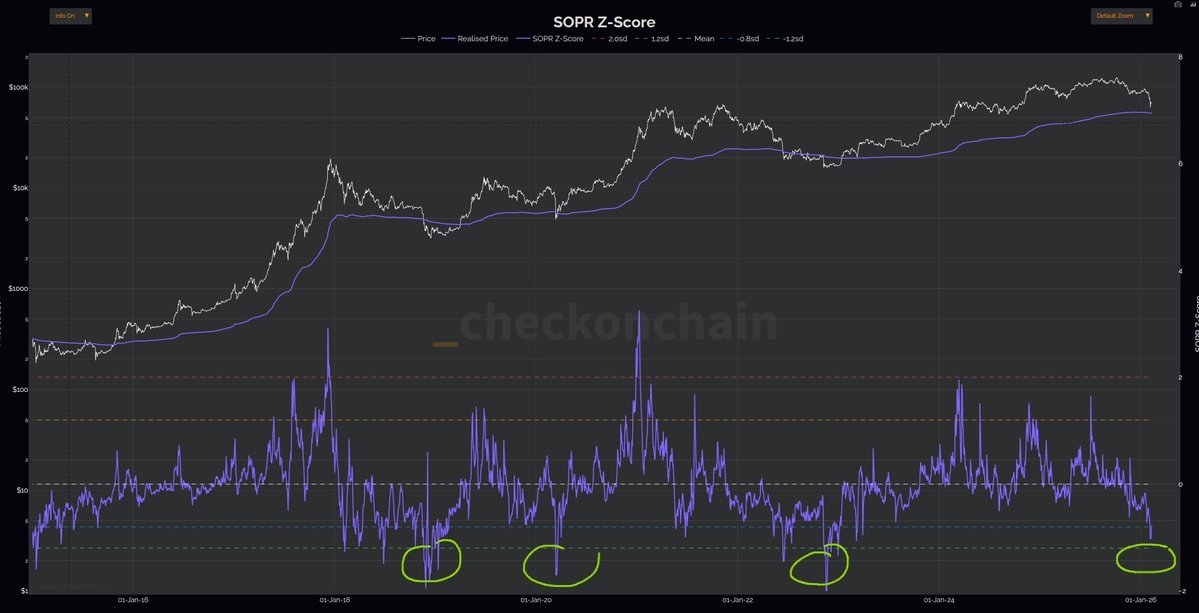
SOPR Z-Score
Also a signal to judge whether there is large-scale selling off.. Generally, the green zone represents panic selling out, a capitulation signal.
Historical deep bears have all been in the green zone.. This time, still a bit off
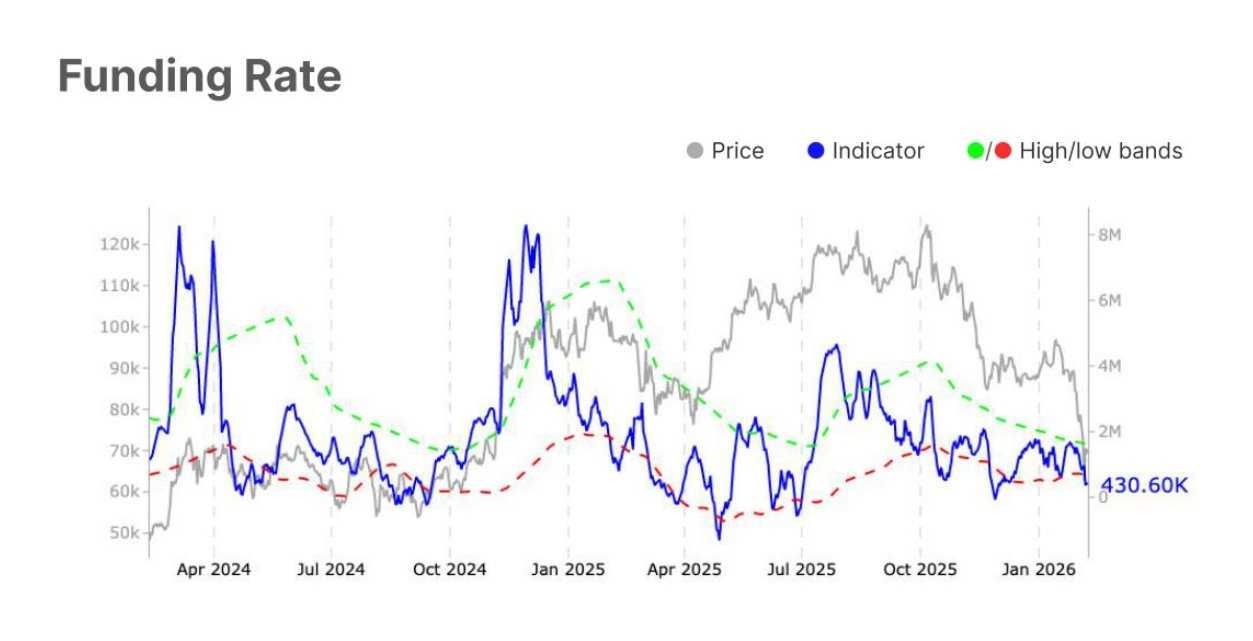
Funding rate
Long funding rates have decreased but have not dropped to negative. Indicates current long confidence is insufficient.
Low rates, arbitrage capital leaving, lack of arbitrage willingness.
Arbitrage requires a positive funding rate, more spots, and short contracts. No arbitrage capital means no spot buying pressure
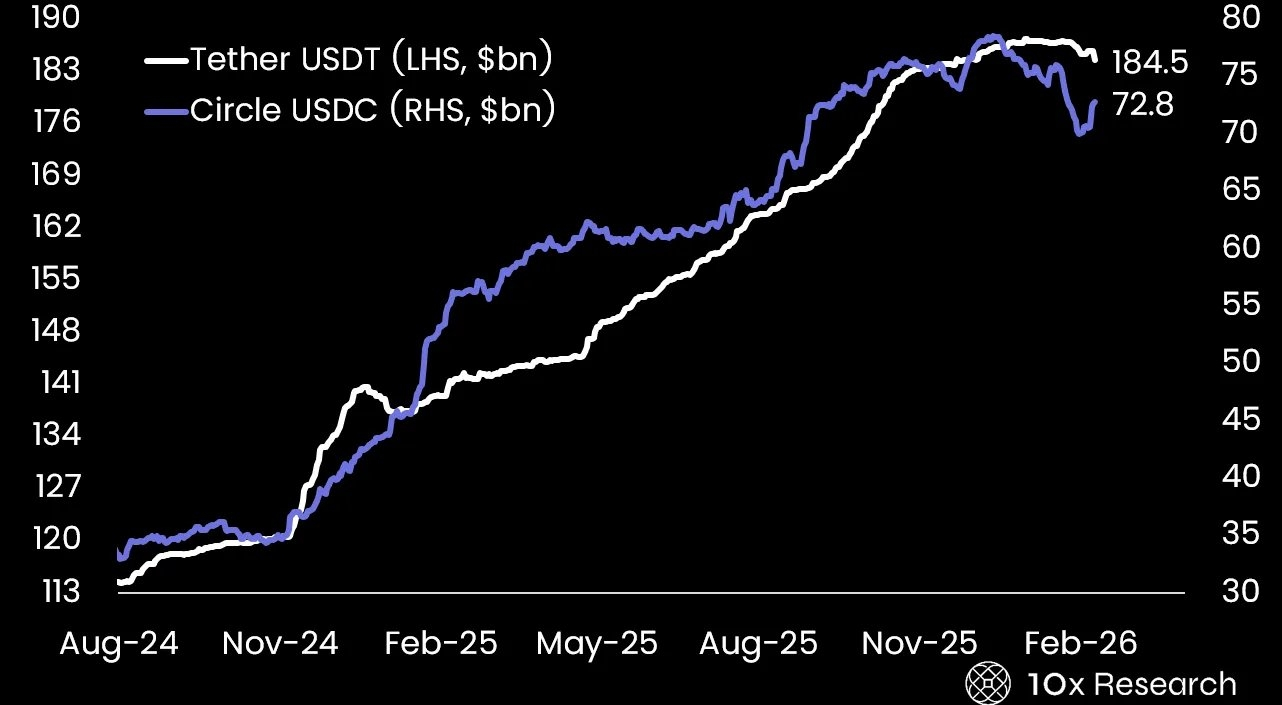
Stablecoin
USDT: Market cap $184.5B, weekly decrease 0.43%
USDC: Market cap $72.8B, weekly increase 3.7% (but previously Circle has redeemed nearly $10B)
Stablecoin minting indicator: at the 2% percentile (extremely negative)
30-day net outflow: $8.5B
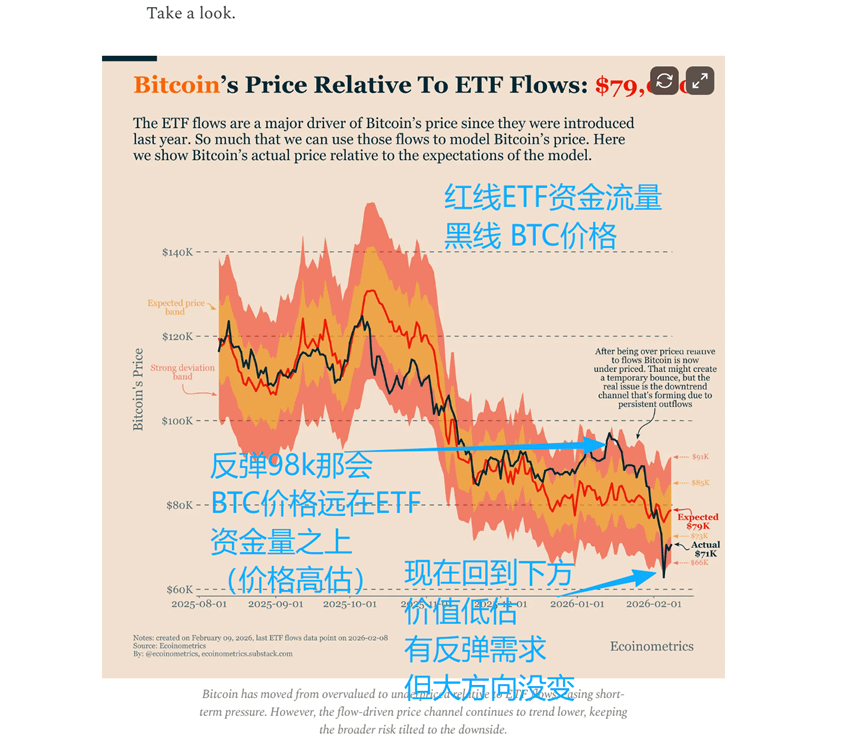
ETF capital flow
Although the outflow speed of ETFs has slowed, it is still in a continuous outflow state
This indicates traditional financial investors have not yet seen an entry signal
Unlike the bottom in October 2023 (when capital had already started flowing in before the ETF launch), there is now a lack of clear catalysts
Summary:
If you can finish reading this data, you will see why all these companies point to this information:
60k this wave has dropped enough, various data indicate a demand for short-term repair;
But there is also a lot of data indicating that if we have already entered the bear market phase, we are not yet in the deep bear bottom zone.
There is demand for a rebound, which is also a high-probability event, and it has already rebounded to 72k;
But where will this wave of rebound go?
This is currently data that cannot tell us anything;
