IT MUST BE A TRAP
A lot has been said about #xrp and despite #ETFs his name has gained value, and rightly so because the existence of an ETF for this crypto asset gives it greater confidence and prestige compared to other projects. However, despite being sent to the moon, its price has fallen quite a bit without mentioning percentages; it is obvious after the overall market decline.
It is important to look at some aspects: one is its popularity and constant free advertising that holders do about its near future, and on the other hand, what some indicators show.
Not for that reason do I want to seem arrogant by saying that I know where the price is going, but I can speak to you about what I am seeing in the chart.
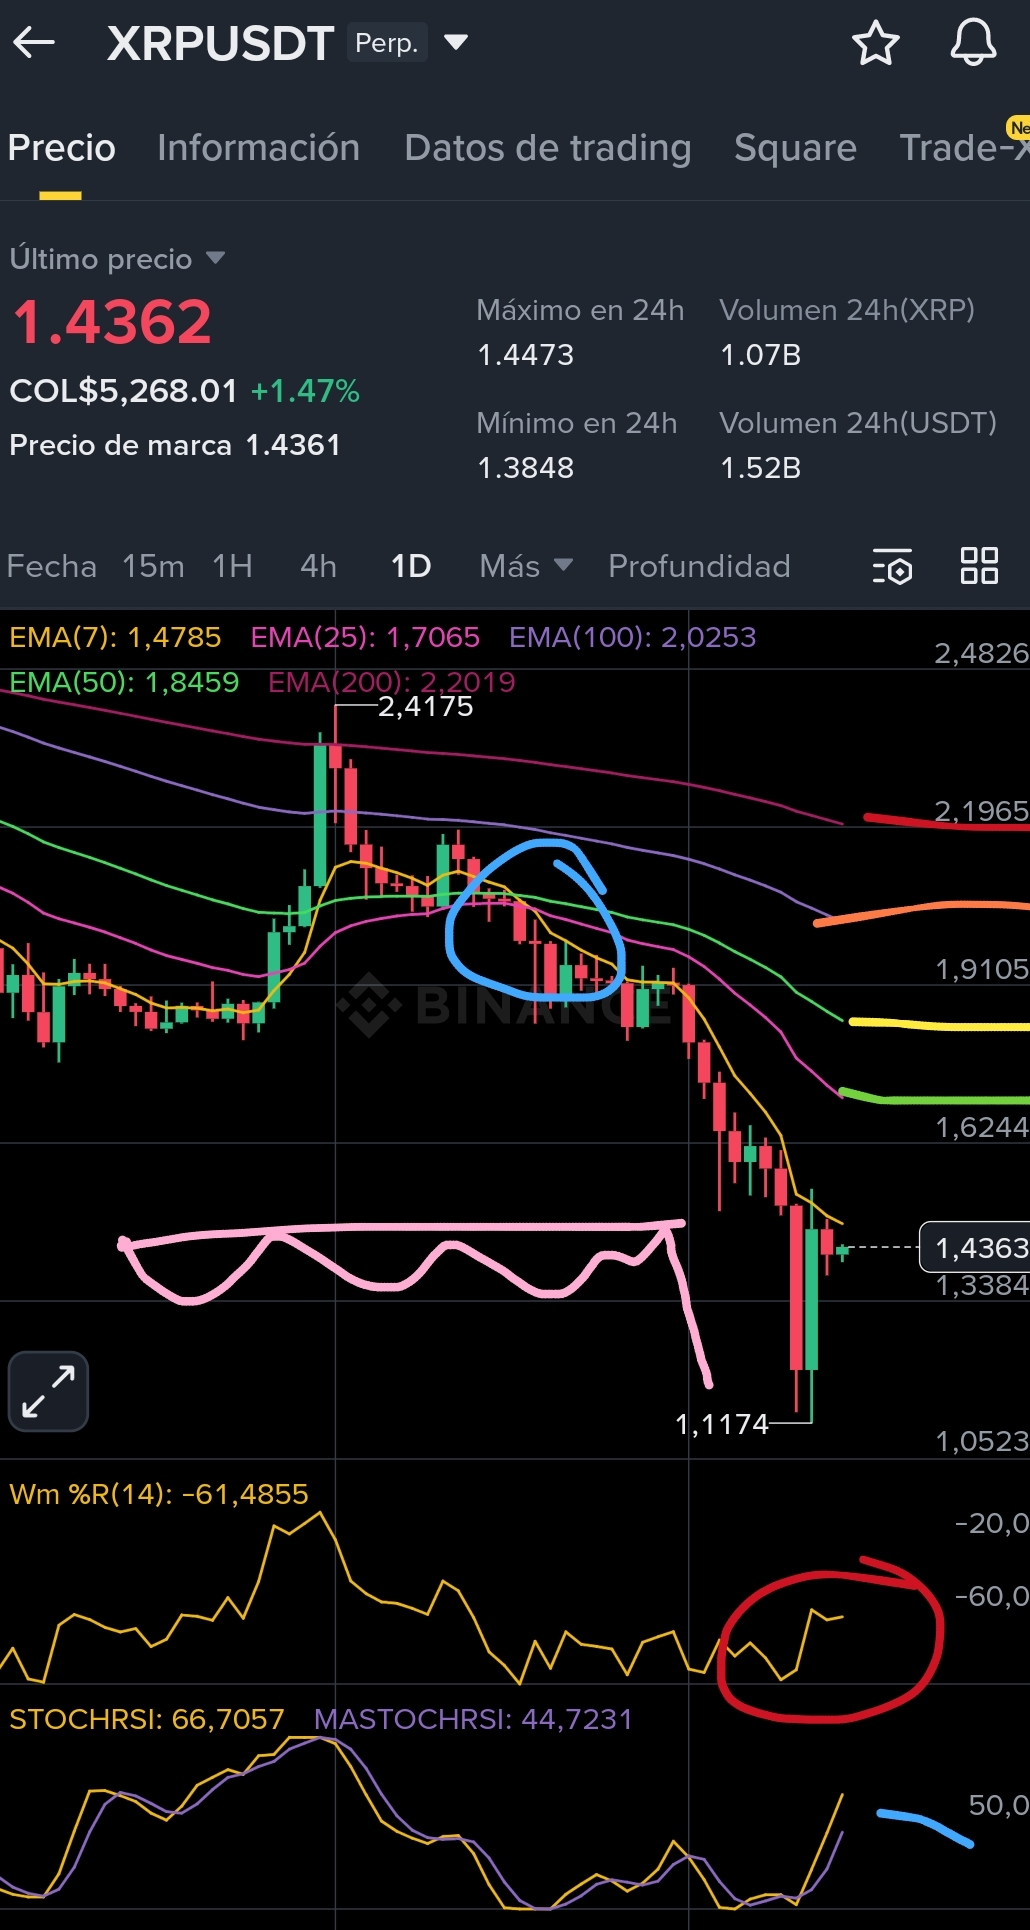
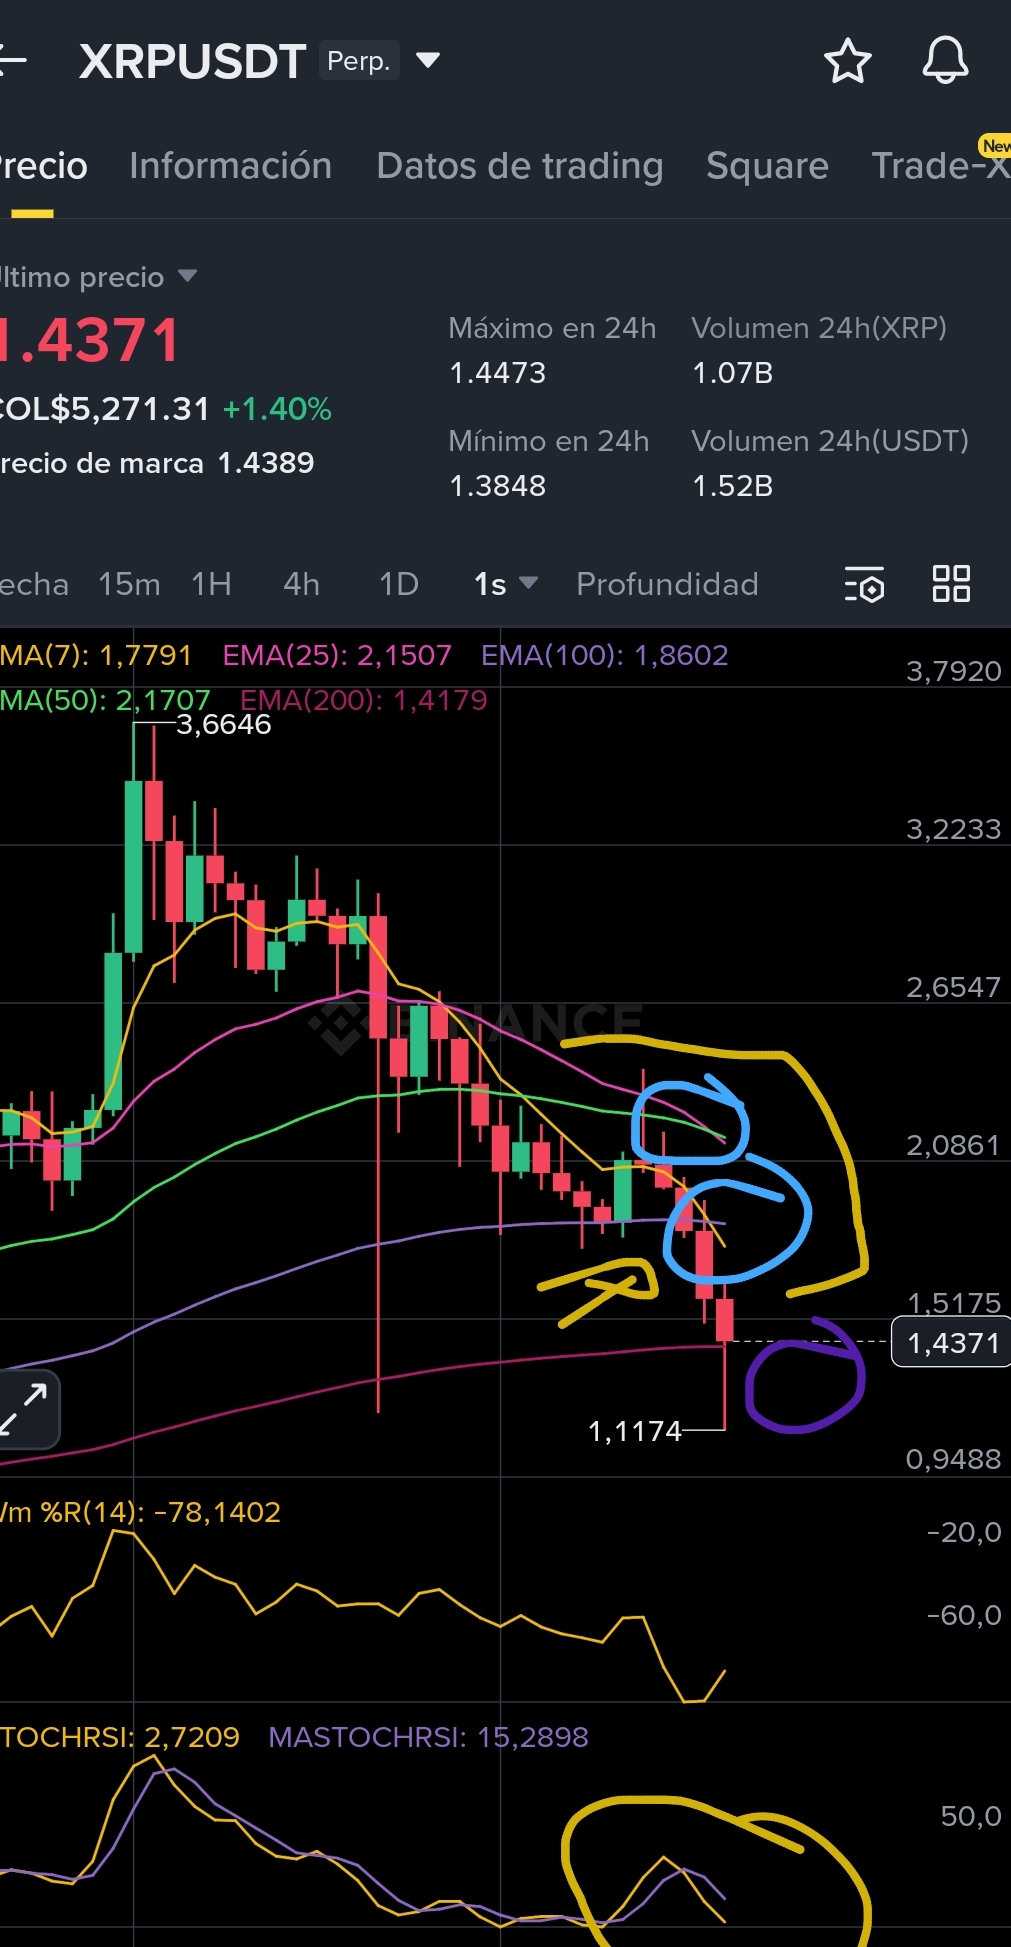
For this, I took the 1-week and 1-month chart into account to consider the weight given by its structure and indicators; however, let’s remember that indicators lag behind the price, so they are just a footprint or a trace of what the market is doing or has been doing.
For this, I configured the EMAs like this, 7, 25, 50, 100, 200 to be more certain from a technical standpoint about what trend the market momentum is in, therefore they are important to see how they react in relation to continuity or a possible breakout or change of direction. Likewise, the RSI, MACD, wM, to measure the momentum. So I have selected in the charts some aspects like crossing moving averages and what this means for the price, as it is either a very calculated trap to deceive technical traders and then rebound and break averages, or it may be that they are confirming a greater drop than what has been seen in recent days.
This would change things, and I believe that the institutions' strategy is to liquidate, lower the currency to then be able to accumulate much more and repeat the cycle.
So if we are going to sell in futures or in spot wherever you want, I should wait for the price to attempt to turn the averages looking for short position stops above in the moving averages context and for the price to be rejected and for this to confirm the crossover, then it would be a short; if not, it would be a market trap and to enter long or buy, then we must wait for either the price to fall with the averages and consolidate or break the averages and hold above to confirm the buy order. If it does not confirm, let’s wait for the averages to dominate again and for the price to come back, to sell from there looking for support and even a further breakdown to 0.8 in a more negative outlook.
If the price manages to humiliate the measures and holds, it could be that the price attempts to break the historical maximum. And seeks 4 or 5 dollars as some visionaries say.
Advice: Remember to manage your capital.