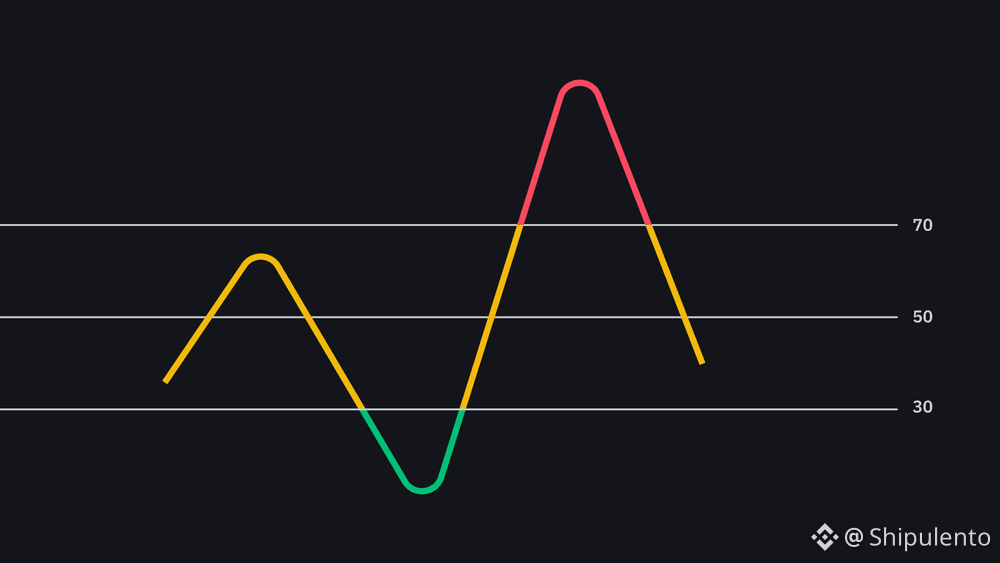
The RSI (Relative Strength Index) indicator
It is a momentum oscillator that measures the speed and change of price movements.
It moves on a scale from 0 to 100.
Overbought: Above 70. It suggests that the price has risen too much and a correction may come.
Oversold: Below 30. It suggests that the price has fallen too much and a rebound may occur.
Divergences: If the price rises but the RSI falls, it is a very strong technical signal of weakness.
#trading #TradingCommunity #tradingtechnique #indicadores
It is a momentum oscillator that measures the speed and change of price movements.
It moves on a scale from 0 to 100.
Overbought: Above 70. It suggests that the price has risen too much and a correction may come.
Oversold: Below 30. It suggests that the price has fallen too much and a rebound may occur.
Divergences: If the price rises but the RSI falls, it is a very strong technical signal of weakness.
#trading #TradingCommunity #tradingtechnique #indicadores