

1️⃣ Regular Bearish Divergence
Price makes higher highs 📈
Indicator (e.g., RSI, MACD) makes lower highs 📉
👉 Signal: Trend reversal (downside likely).
2️⃣ Hidden Bearish Divergence
Price makes lower highs 📉
Indicator makes higher highs 📈
👉 Signal: Continuation of downtrend.
3️⃣ Exaggerated Bearish Divergence
Price forms a double top (equal highs) ➖
Indicator makes lower highs 📉
👉 Signal: Strong bearish reversal.
---
🟢 Bullish Divergences (Bottom Row → Trend going up)
4️⃣ Regular Bullish Divergence
Price makes lower lows 📉
Indicator makes higher lows 📈
👉 Signal: Trend reversal (upside likely).
5️⃣ Hidden Bullish Divergence
Price makes higher lows 📈
Indicator makes lower lows 📉
👉 Signal: Continuation of uptrend.
6️⃣ Exaggerated Bullish Divergence
Price forms a double bottom (equal lows) ➖
Indicator makes higher lows 📈
👉 Signal: Strong bullish reversal.
HERE is the image 👇
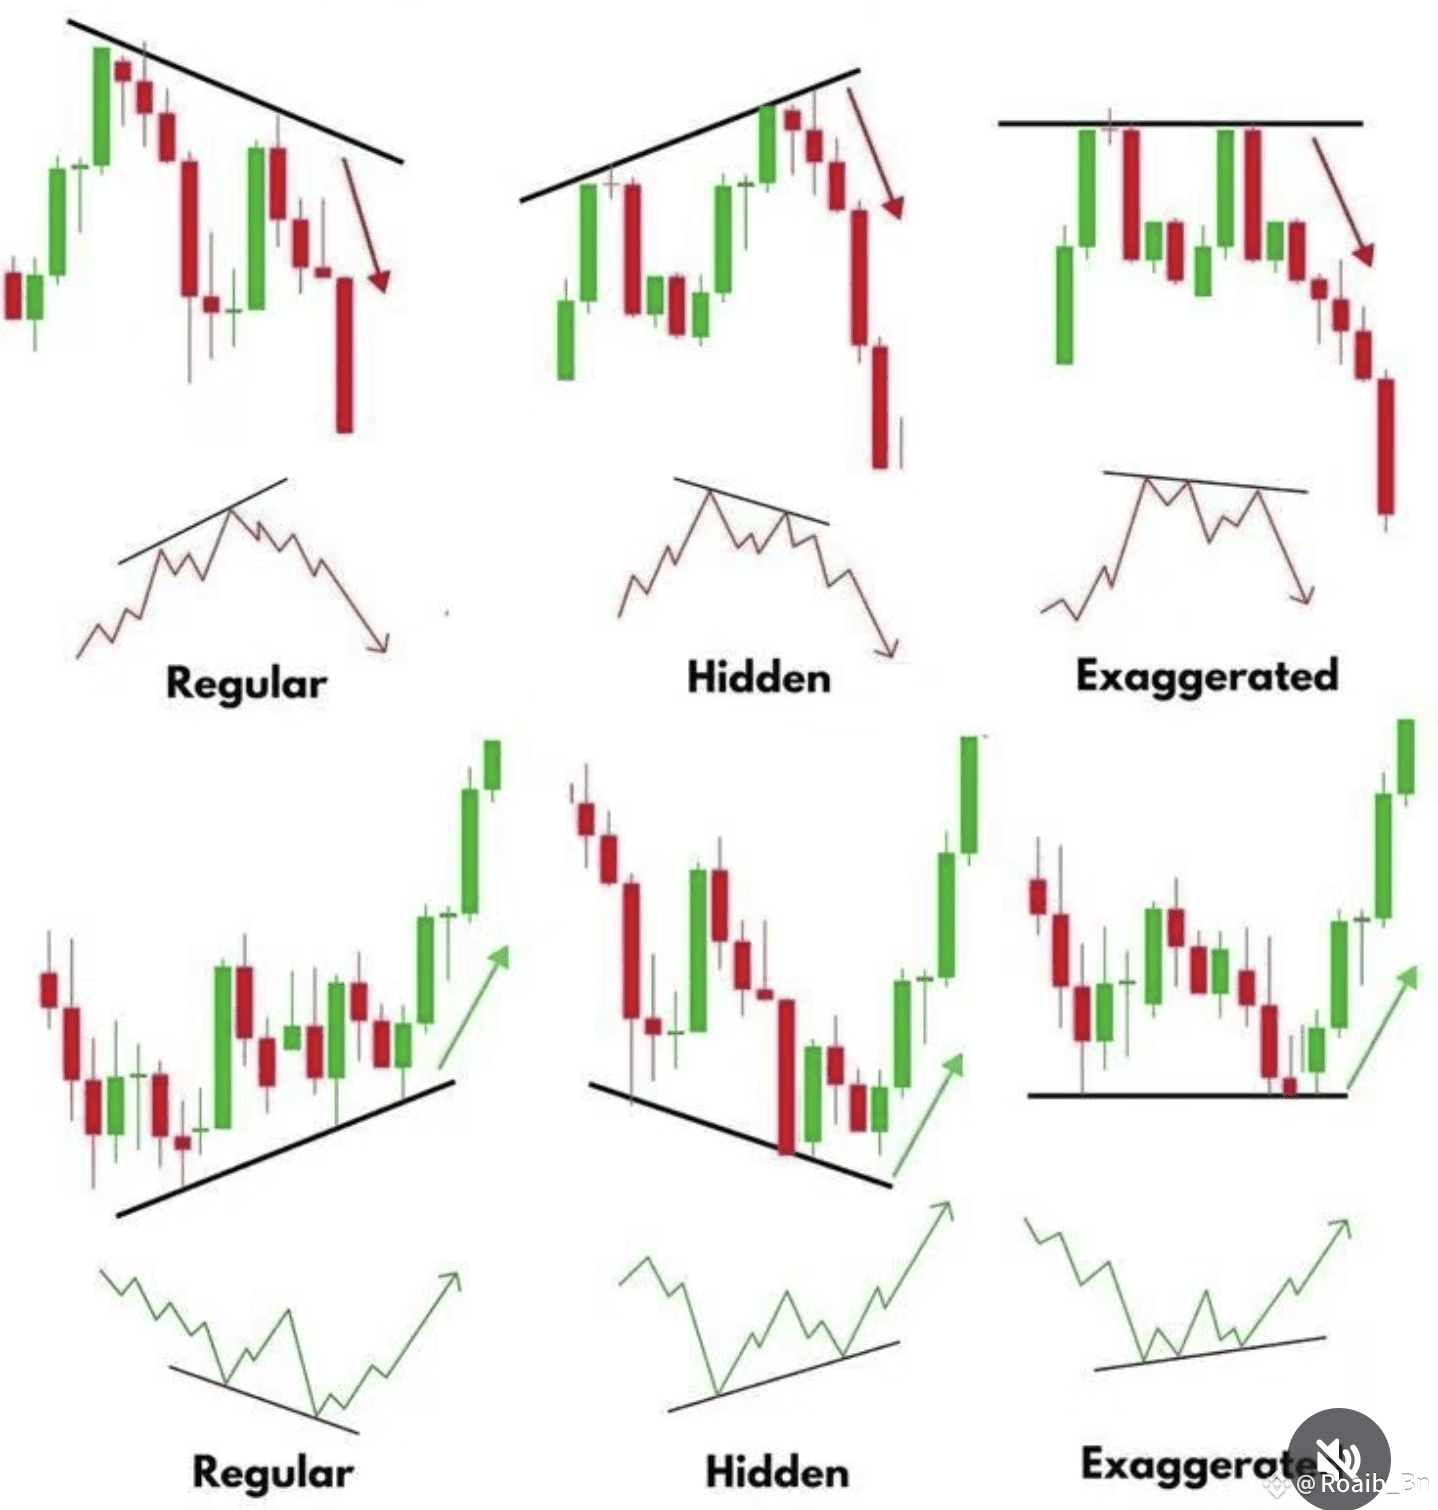
✅ In short:
Regular Divergence = Reversal signal
Hidden Divergence = Trend continuation
Exaggerated Divergence = Strong reversal from double tops/bottoms
#BNBATH880 #CryptoRally #AKEBinanceTGE #MarketPullback #FOMCMinutes