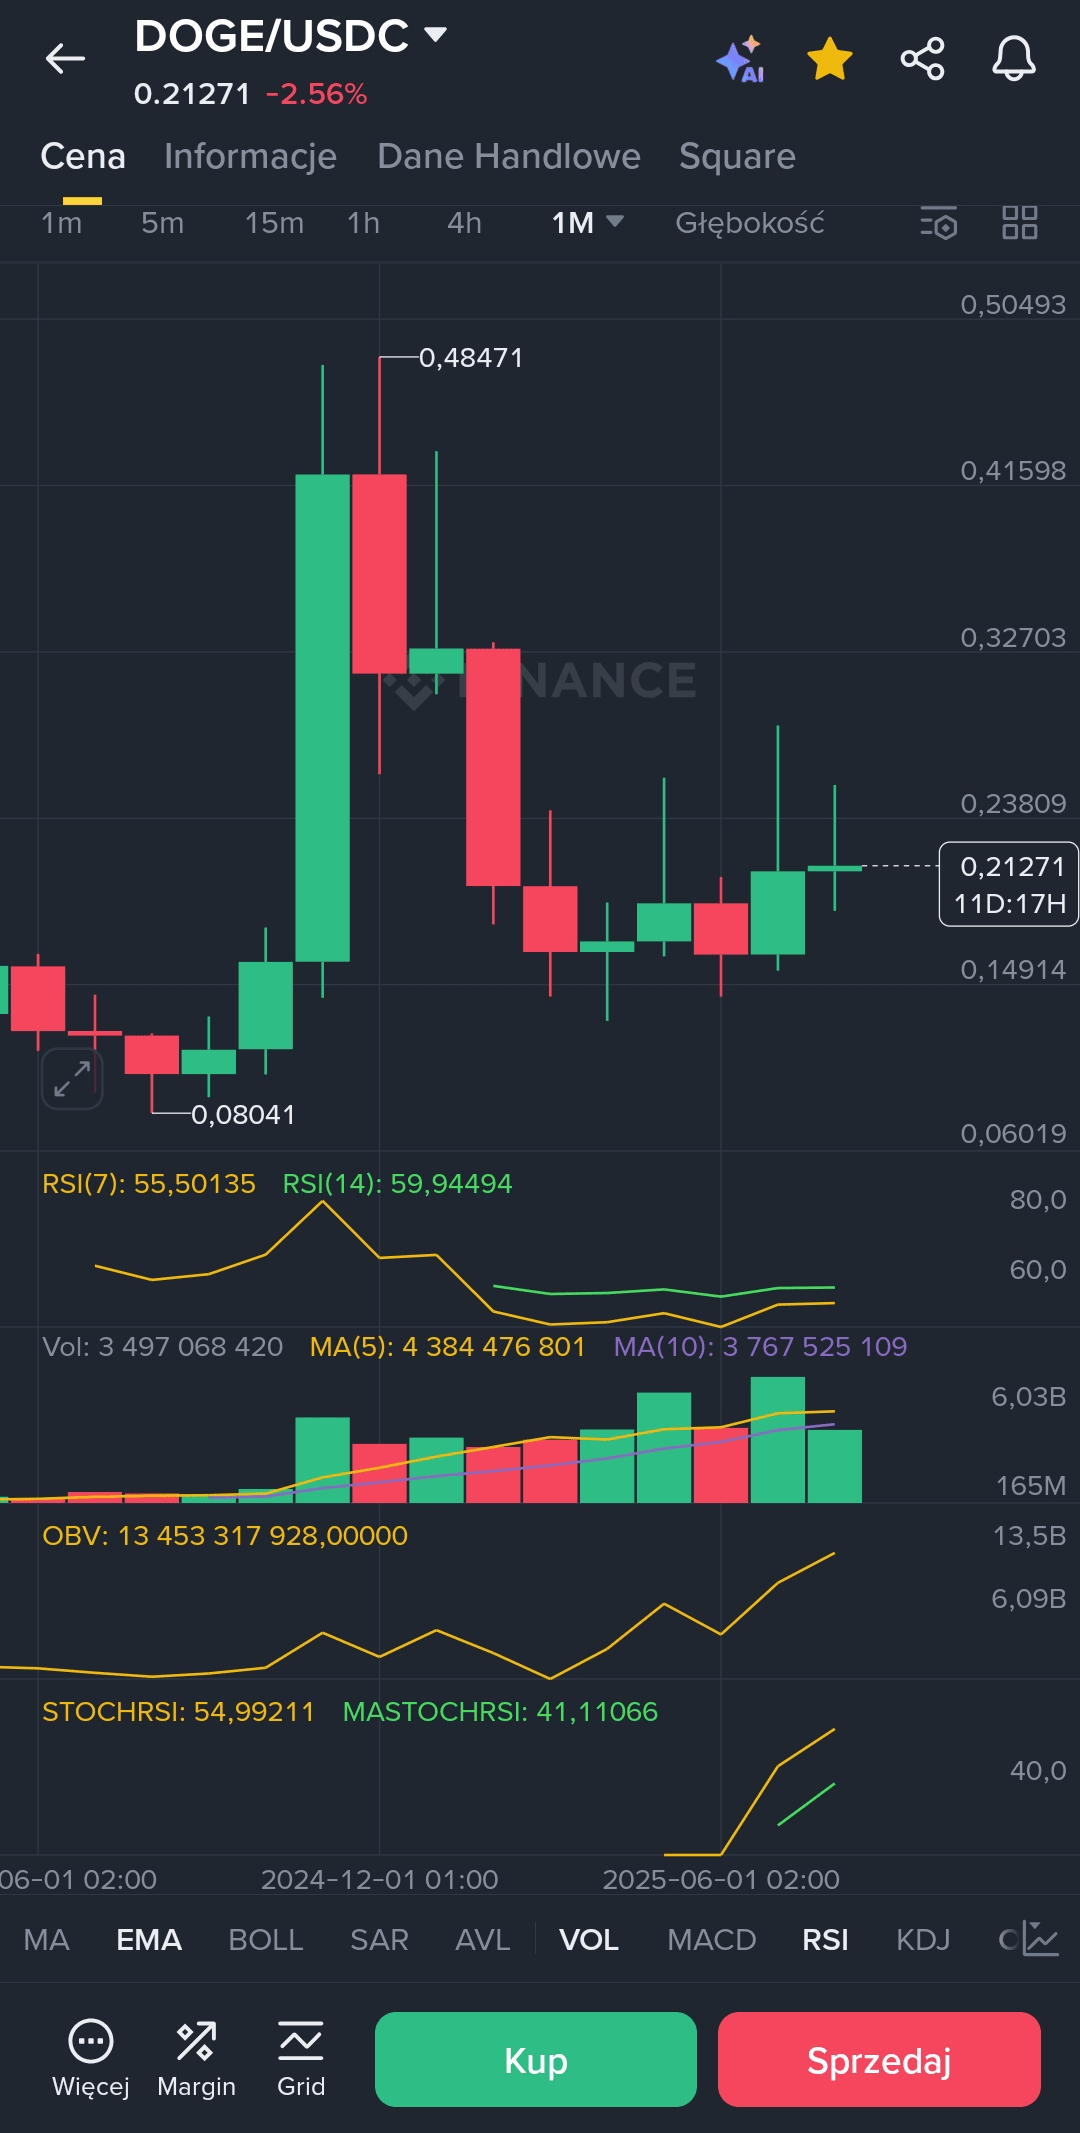
1. Price and monthly candle
Current price: 0.21271 USDC (drop -2.56%).
Since the beginning of the month, the candle is green, but with a slight pullback – this indicates an attempt to break out, but there is still no strong confirmation of the trend.
Important levels:
Support: 0.15 – 0.16 USDC (it has bounced there several times).
Resistance: 0.24 – 0.25 USDC (recent peaks).
Another strong resistance: 0.32 USDC.
2. RSI (Relative Strength Index)
RSI(14): 59.94 → the market is slightly above the middle, but not yet in the overbought zone (70+). This means DOGE has room for further growth before stronger selling pressure appears.
RSI(7): 55.50 → neutral in the short term, close to the middle.
3. StochRSI
StochRSI: 54.99, maStochRSI: 41.11 → crossing upwards, which is a bullish signal (potential rebound in progress).
4. OBV (On-Balance Volume)
OBV: 13.45B – an upward trend in volume is visible. This means fresh money is entering, which usually supports further increases.
5. Moving averages
MA(5): 4.38B vs MA(10): 3.76B → the shorter average is above the longer, which technically is a bullish signal.
🔎 Technical summary
Long-term trend (1M): consolidation after a significant drop from 0.48 → but a rebound is visible and an attempt to form a bottom around 0.15.
Short-term: signals are slowly indicating increases (RSI up, StochRSI signals a rebound, MA5 > MA10).
Key moment: if DOGE breaks 0.238 – 0.25 USDC, it may quickly move towards 0.32 USDC. If it pulls back, a retest of 0.16 USDC is possible.
👉 Currently, the market looks more bullish than bearish, but a breakout above 0.24 is needed to confirm a larger upward move.