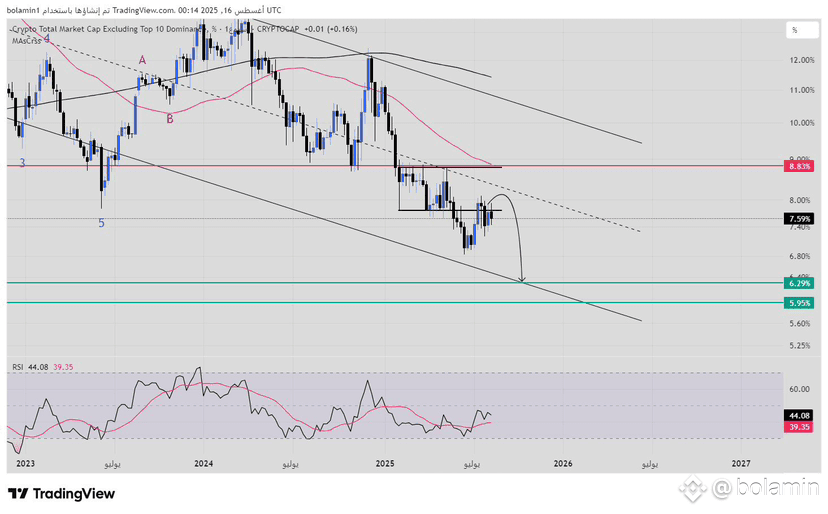
Update on the altcoin acquisition chart OTHERS.D
Everyone who follows me knows it is the most followed chart
Unfortunately, even at this moment, the chart is negative
From a technical perspective, we have resistance at 7.75% from which the price has bounced multiple times, and even when it broke with a weekly candle, we saw that it never stabilized above it. The resistance is very strong, and the chart leans more towards negativity.
In case we break the previous low, we will head directly to the 6.29% area, from which a strong rebound is expected, God willing.
From a wave perspective, the situation is not much different. The wave scenario suggests that we still have one final downward wave towards the 5.95% area.
All this negativity ends with a daily close above 8.83%. Reaching this area means the beginning of the spark for the bull run, God willing.
Any changes in the outlook or price behavior will be updated, God willing. ✅
Everyone who follows me knows it is the most followed chart
Unfortunately, even at this moment, the chart is negative
From a technical perspective, we have resistance at 7.75% from which the price has bounced multiple times, and even when it broke with a weekly candle, we saw that it never stabilized above it. The resistance is very strong, and the chart leans more towards negativity.
In case we break the previous low, we will head directly to the 6.29% area, from which a strong rebound is expected, God willing.
From a wave perspective, the situation is not much different. The wave scenario suggests that we still have one final downward wave towards the 5.95% area.
All this negativity ends with a daily close above 8.83%. Reaching this area means the beginning of the spark for the bull run, God willing.
Any changes in the outlook or price behavior will be updated, God willing. ✅