

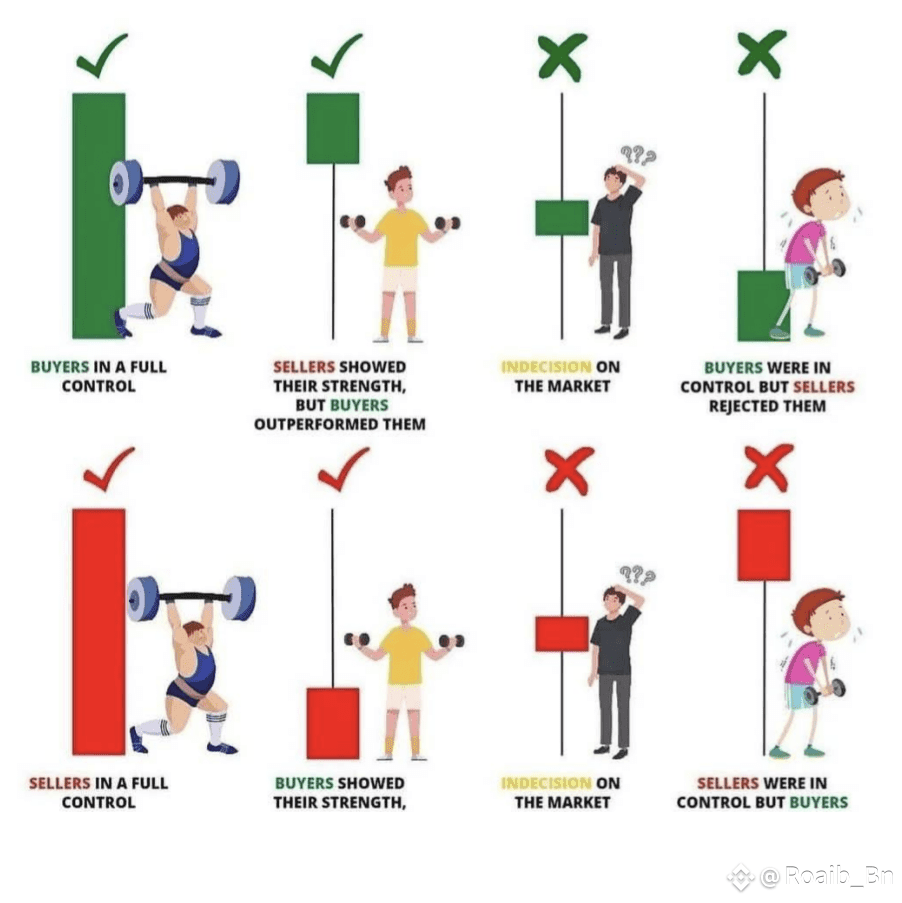
🔹 Top Row (Left to Right):
1. ✅ Buyers in Full Control
🟩 Big green candle — strong bullish momentum, buyers dominated the session.
2. ✅ Sellers Showed Strength, but Buyers Outperformed
🟩 Long lower wick — sellers pushed price down but buyers recovered and closed higher.
3. ❌ Indecision on the Market
🟫 Doji candle — equal pressure from buyers and sellers, showing market uncertainty.
4. ✅ Buyers Were in Control but Sellers Rejected Them
🟩 Long upper wick — buyers pushed price up, but sellers forced a lower close.
---
🔹 Bottom Row (Left to Right):
5. ✅ Sellers in Full Control
🟥 Big red candle — strong bearish momentum, sellers dominated the session.
6. ✅ Buyers Showed Their Strength
🟥 Long lower wick — buyers tried to fight back after sellers pushed the price down.
7. ❌ Indecision on the Market
🟧 Small-bodied candle with wicks — uncertainty; no clear winner between buyers or sellers.
8. ❌ Sellers Were in Control but Buyers Rejected Them
🟥 Long lower wick — sellers drove price down but buyers regained ground before close.
---
💡 Summary:
✔️ Long candles = clear strength
❌ Dojis = indecision
✔️ Wicks = rejection or recovery
This chart helps you read the emotions behind the candles 🧠🔥
HERE is the candles image 👇
IF you find the post helpful then please follow like and comment on it thanks 👍
#notcoin #BuiltonSolayer #IPOWave #BTCUnbound #CFTCCryptoSprint