$CFX
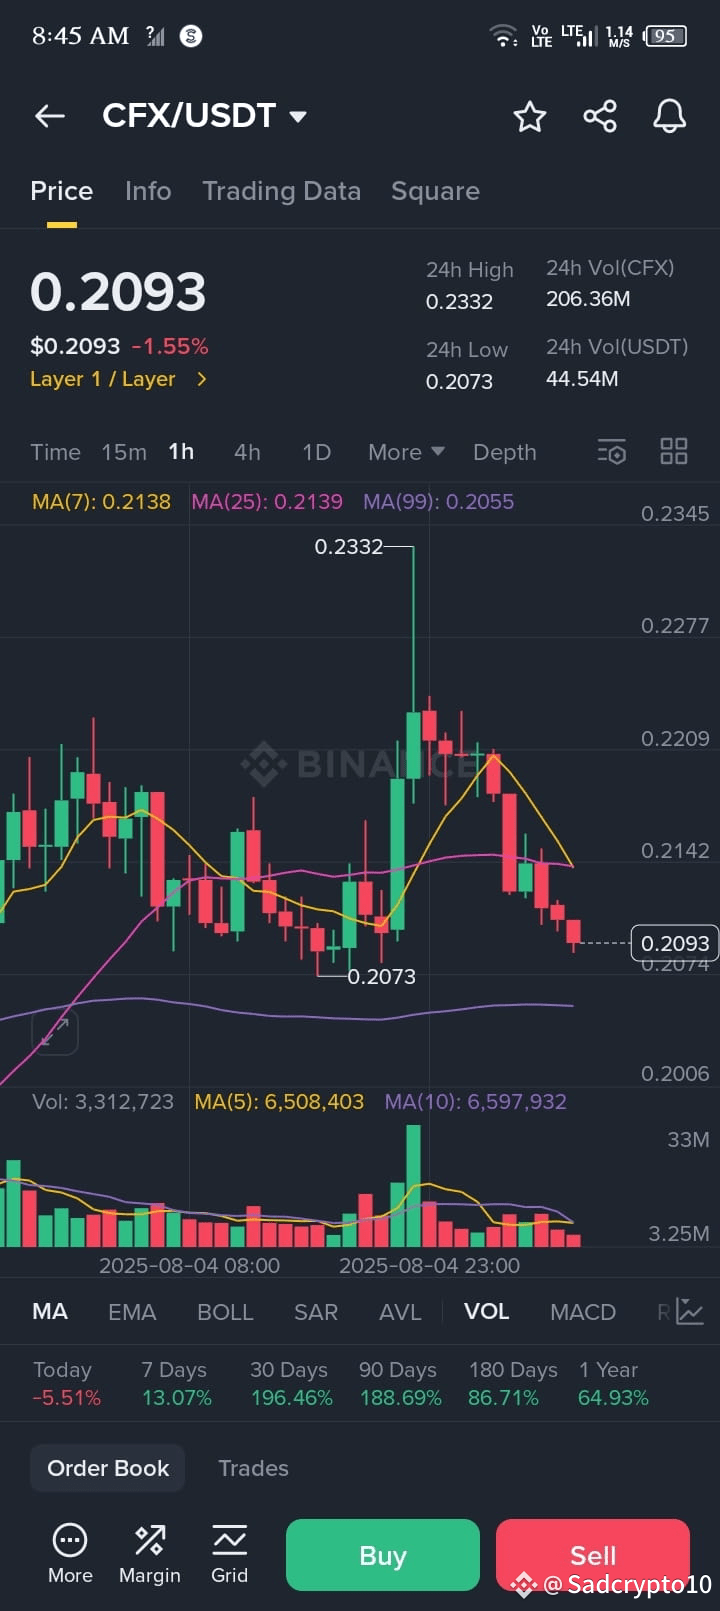
Based on the technical data and price structure visible in your chart, here are the key **support (S)** and **resistance (R)** levels for **CFX/USDT**:
---
### **Support Levels** (Price Floor - Bulls Defend Here)
1. **S1: $0.2073–0.2074**
- Today's low (strongest support).
2. **S2: $0.2055**
- MA(99) - Long-term moving average (dynamic support).
3. **S3: $0.2006**
- Psychological level & recent swing low (major support if tested).
---
### **Resistance Levels** (Price Ceiling - Bears Defend Here)
1. **R1: $0.2138–0.2139**
- Confluence of MA(7) and MA(25) (immediate resistance).
2. **R2: $0.2209**
- Recent swing high (next barrier).
3. **R3: $0.2332**
- Today's high (strongest resistance).
---
### **Key Observations**:
- **Current Price Action**: Trading at **$0.2093**, below all short-term MAs (bearish near-term).
- **Volume**: Declining (MA(5) > current volume), suggesting weak momentum.
- **Critical Zone**: A break below **$0.2073** could trigger further downside toward **$0.2006**. Conversely, reclaiming **$0.2139** (MA cluster) is needed for recovery.
---
### **Trading Implications**:
- **Bearish Short-Term**: Price below MA(7)/MA(25) with negative daily momentum (-5.51%).
- **Strategy**:
- *Short/Bearish*: If price fails at R1 ($0.2139) or breaks S1 ($0.2073).
- *Long/Bullish*: Only if price holds S2 ($0.2055) and breaks above R2 ($0.2209).
> ⚠️ **Disclaimer**: These levels are derived from visible data. Always confirm with real-time charts and manage risk. Cryptocurrency markets are volatile.
Let me know if you need deeper analysis (e.g., MACD, RSI interpretation)!