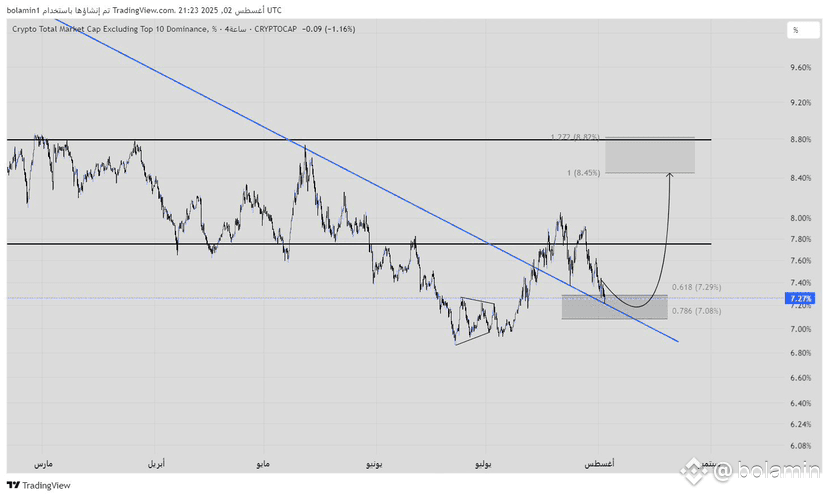
The last chart is the chart of alternative coin acquisition OTHERS.D
This chart has been monitored for a while and is considered very, very important, and by God's grace, we managed to analyze it and catch its previous bottom 📌
On the daily frame, the downward trend was broken, and a retest occurred with a potential rebound area
If a rebound occurs from this point, it aims for
8.45%
9%
The 9% area is a strong resistance, and if a weekly close occurs above it, this indicates the start of a bull run
However, let's not jump to conclusions; we might see good speculative rises this week of 30%-50% in some coins. If there is good interaction, we will publish some coins with targets and strict stop losses
And in the end ❤️
(If I have succeeded, it is from my Lord, and if I have failed, it is from myself and my devil)
#ProjectCrypto
#FOMCMeeting
This chart has been monitored for a while and is considered very, very important, and by God's grace, we managed to analyze it and catch its previous bottom 📌
On the daily frame, the downward trend was broken, and a retest occurred with a potential rebound area
If a rebound occurs from this point, it aims for
8.45%
9%
The 9% area is a strong resistance, and if a weekly close occurs above it, this indicates the start of a bull run
However, let's not jump to conclusions; we might see good speculative rises this week of 30%-50% in some coins. If there is good interaction, we will publish some coins with targets and strict stop losses
And in the end ❤️
(If I have succeeded, it is from my Lord, and if I have failed, it is from myself and my devil)
#ProjectCrypto
#FOMCMeeting