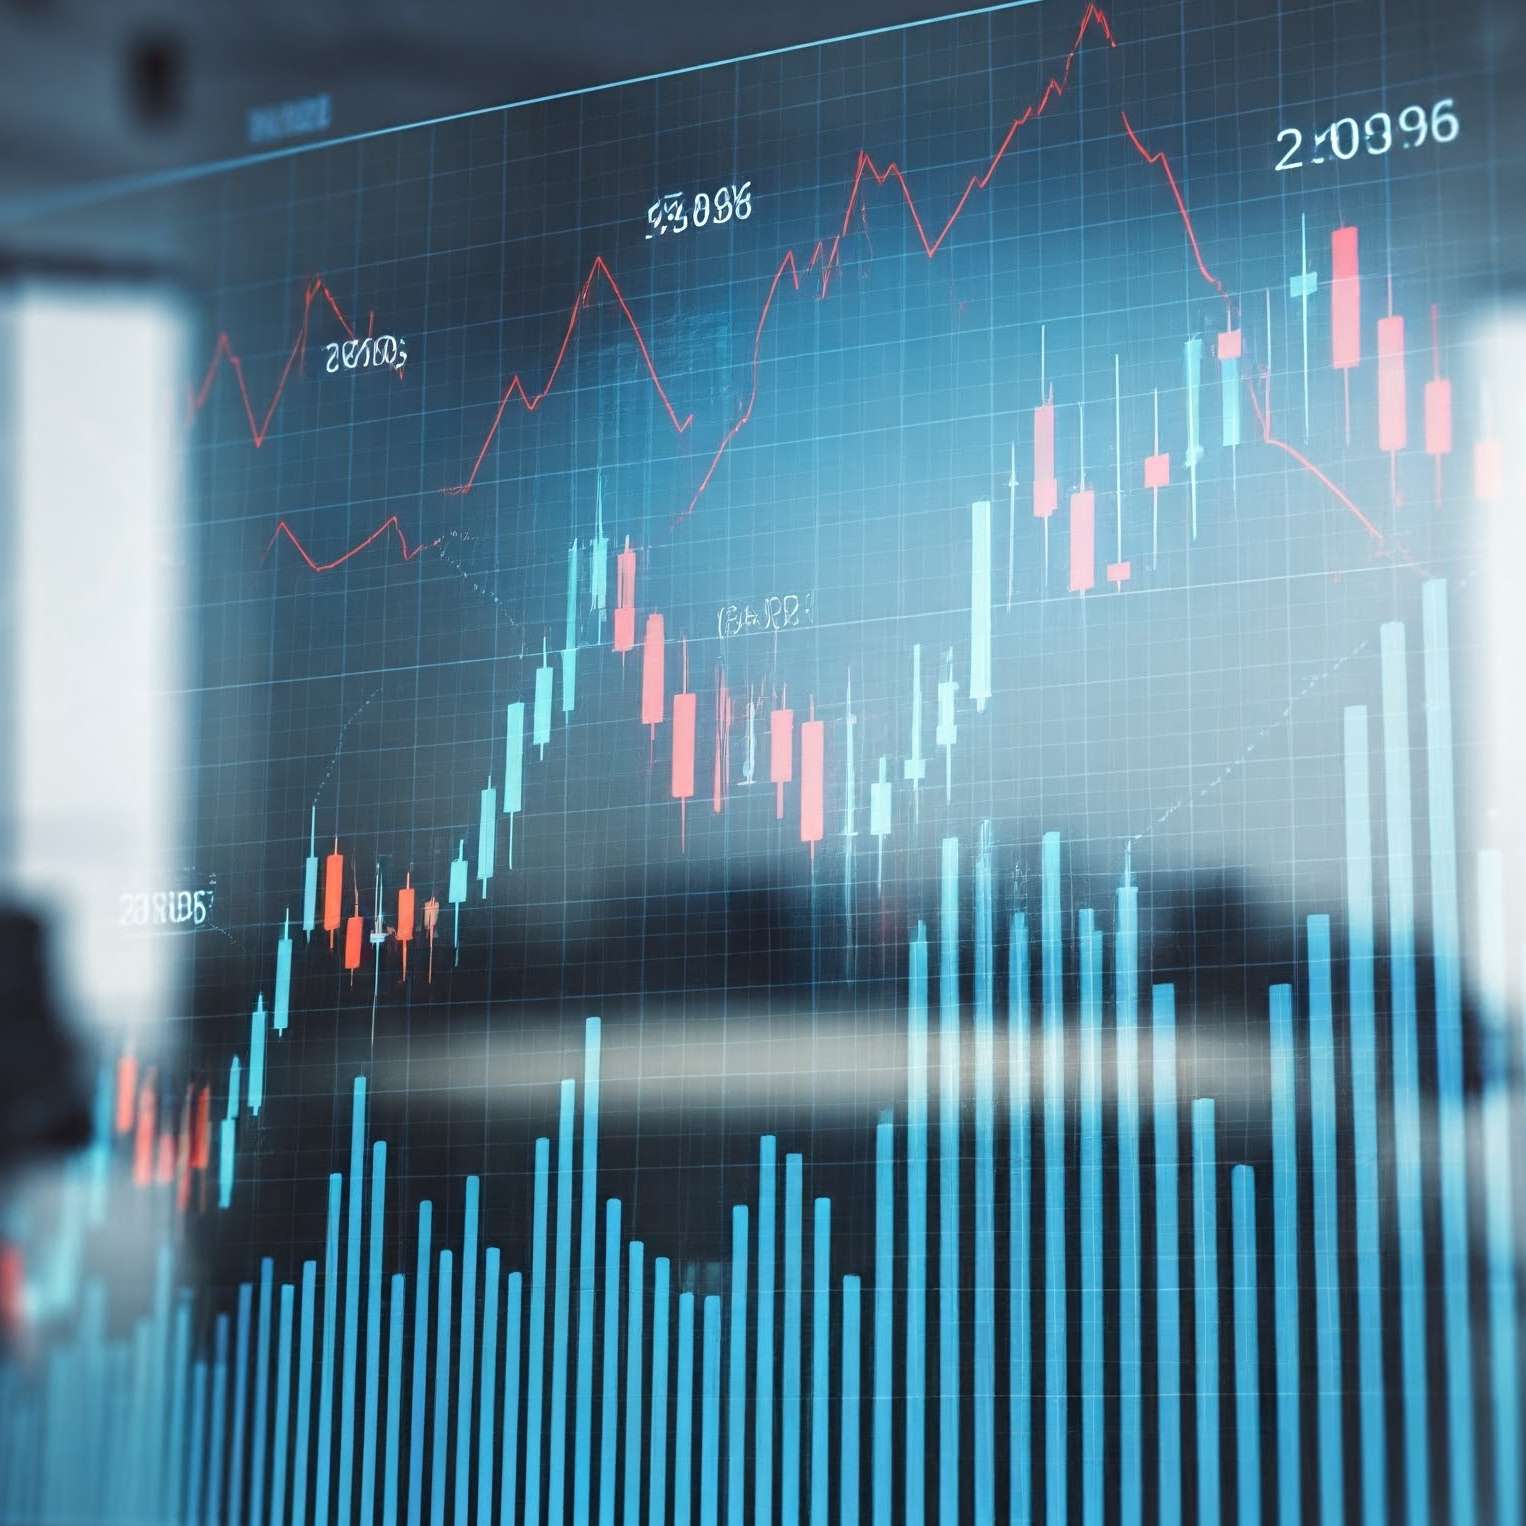
When we analyze a currency #BNB or any other currency, we see these candles referred to as Japanese candles.
Candlestick charts are among the most famous tools of technical analysis, resembling a 'market language' that tells you what is happening inside each candle: Who is in control? Buyers or sellers? Is there an upcoming opportunity or a looming danger? When we analyze a currency, candlestick charts are among the most famous tools of technical analysis, resembling a 'market language' that tells you what is happening inside each candle: Who is in control? Buyers or sellers? Is there an upcoming opportunity or a looming danger?
---
✅ What is a candle made of?
Each candle represents price movement over a specific time period (like 1 hour or 1 day) and consists of:
📍 Candle Body: The difference between the opening and closing price.
📍 Upper Wick: The highest price reached during the period.
📍 Lower Wick: The lowest price reached.
🔸 If the closing price is higher than the opening ⇒ Bullish candle (often green)
🔸 If the closing price is lower than the opening ⇒ Bearish candle (often red)
---
🧠 What does the candle tell you?
The candle is not just a shape; it tells you a lot:
What does the shape mean?
Long body Strength in direction (strong buying or selling)
Small body and long shadows Indecision or struggle between buyers and sellers
Long upper shadow Selling pressure after a rise
Long lower shadow Buying pressure after a drop
---
🔥 Examples of some important candle types
1. Doji Candle:
A candle with a very small body, indicating market indecision, often appears before a trend reversal.
2. Hammer Candle:
Small body and long lower shadow, often seen at bottoms and indicating a potential rise.
3. Hanging Man Candle:
Resembles a hammer but at the peaks, and may signal an upcoming drop.
4. Engulfing Candle:
A candle that engulfs the previous candle, indicating a strong change in direction.
---
🎯 How to use candles?
Don't rely on just one candle!
Look for market context, support or resistance levels, and confirmation from multiple candles.
Use candles with other tools like RSI or MACD or trend lines.
---
🧩 Summary:
Candles are not just beautiful patterns; they reflect the psychology of what is happening between buyers and sellers. The more you learn to read them deeply, the more conscious and confident your decisions become.
$$BTC
A drop could be an opportunity if you understand trading, and there might be more drops; understand trading, and you will achieve great success.