


🔶 Overview:
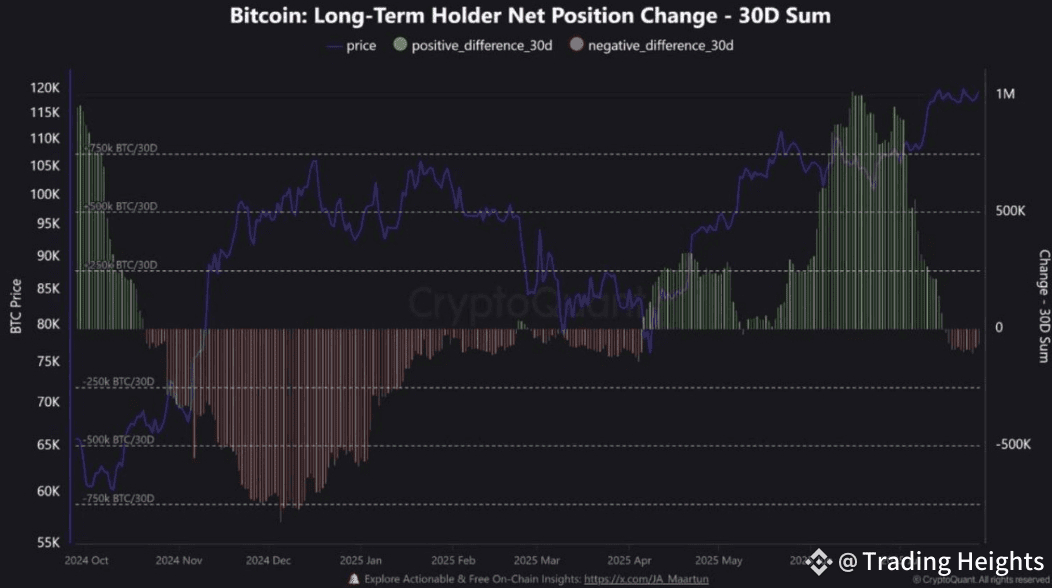
This chart shows how long-term Bitcoin holders are accumulating or distributing their BTC over a 30-day period.
📊 Key Insights:
🔶 Price Trend (Blue Line):
BTC price has been trending upwards from $60K (Oct 2024) to above $115K (Jul 2025).
🔶 Accumulation Phase (Green Bars):
Significant accumulation started in April 2025, peaking in June 2025 with nearly +1M BTC (30D Sum) added by long-term holders.
This strong accumulation coincided with a sharp price increase.
🔶 Distribution Phase (Red Bars):
Heavy distribution occurred between Nov 2024 – Mar 2025, with a net change of around -750K BTC (30D Sum), which caused downward price pressure.
Recently, a small distribution signal is emerging (Jul 2025), indicating some profit-taking at the top levels.
🔶 Market Implication:
If the negative red bars grow, we may see short-term corrections.
However, the current $BTC price remains bullish, supported by previous strong accumulation.
💡 Conclusion:
Long-term holders' activity shows that accumulation drives rallies, while distribution phases often trigger pullbacks. Monitoring this indicator is crucial for predicting Bitcoin’s next move.