
星期天-77
18.2k Posts

星期天-77
 Square Verified+
人在星期天,心在Web3 ,财神公会在此,牛市埋伏走起!
3.8K+ Following
90.6K+ Followers
99.5K+ Liked
Posts
All
Quotes
Videos
PINNED
The position of “Big Brother A” has shrunk again—its capital has fallen from $11.15 million to $8.8 million.
According to on-chain analyst Yu Jin, monitoring $BTC and $ETH , the prices have been consolidating in the high range over the past few days. As a result, Big Brother A’s capital dropped from $11.15 million to $8.8 million. Yu Jin said the capital decline came from frequent stop-losses and de-risking during periods of slight price dips.
In terms of position details: Big Brother A currently holds a $114 million long position, of which $100 million is in ETH. The ETH long entry price is $2,463, and the liquidation price is $2,307. Compared with the previously mentioned data (entry price of $2,357 and liquidation price of $2,189.8), both the entry and liquidation prices have been raised this time by a step—indicating this is a newly added position, not a continuation of the prior one.
This fits with the further elaboration of the previously mentioned “partially closing the ETH longs, with losses of about $1.96 million.” The account’s total capital has shrunk from $11.15 million to $8.8 million, with cumulative losses exceeding $2 million—basically matching the earlier stop-loss data. Frequent stop-loss de-risking suggests that the past few days of choppy market conditions have indeed been unfriendly to leveraged longs. Even the largest on-chain long account has been experiencing a real drawdown.
With the liquidation price at $2,307, it’s worth keeping a close eye on what happens next.
#SOL本周上涨20% #首笔抗量子比特币交易主网完成 #BTC #ETH $SOL
According to on-chain analyst Yu Jin, monitoring $BTC and $ETH , the prices have been consolidating in the high range over the past few days. As a result, Big Brother A’s capital dropped from $11.15 million to $8.8 million. Yu Jin said the capital decline came from frequent stop-losses and de-risking during periods of slight price dips.
In terms of position details: Big Brother A currently holds a $114 million long position, of which $100 million is in ETH. The ETH long entry price is $2,463, and the liquidation price is $2,307. Compared with the previously mentioned data (entry price of $2,357 and liquidation price of $2,189.8), both the entry and liquidation prices have been raised this time by a step—indicating this is a newly added position, not a continuation of the prior one.
This fits with the further elaboration of the previously mentioned “partially closing the ETH longs, with losses of about $1.96 million.” The account’s total capital has shrunk from $11.15 million to $8.8 million, with cumulative losses exceeding $2 million—basically matching the earlier stop-loss data. Frequent stop-loss de-risking suggests that the past few days of choppy market conditions have indeed been unfriendly to leveraged longs. Even the largest on-chain long account has been experiencing a real drawdown.
With the liquidation price at $2,307, it’s worth keeping a close eye on what happens next.
#SOL本周上涨20% #首笔抗量子比特币交易主网完成 #BTC #ETH $SOL

PINNED
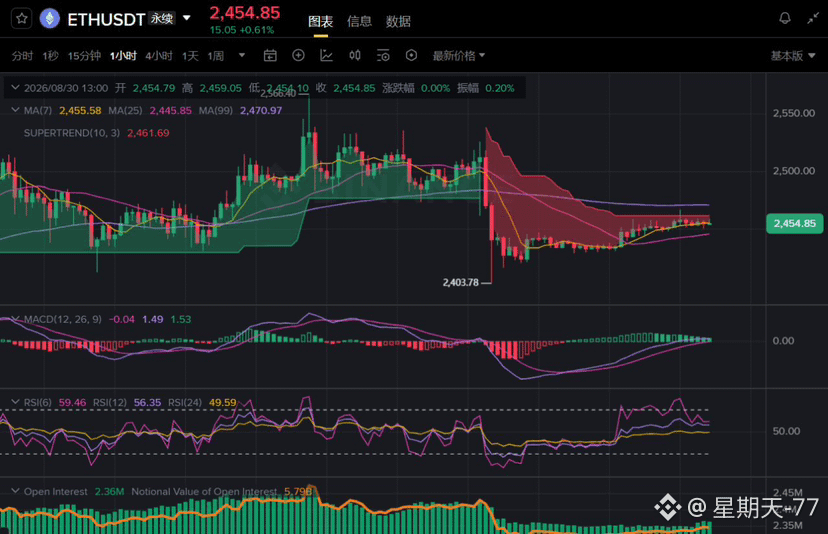
August 31 marks the end of August 🌙
Leave the ups and downs of August’s gains and losses in yesterday.
Let go of anxiety, and set aside regrets.
Summer is drawing to a close—waiting quietly for September to begin.
Meeting each other is fate. In September, let’s gather strength and move upward together ✨
#BTC #ETH #比特币现货ETF结束9日净流入
$BTC $ETH $SOL
Leave the ups and downs of August’s gains and losses in yesterday.
Let go of anxiety, and set aside regrets.
Summer is drawing to a close—waiting quietly for September to begin.
Meeting each other is fate. In September, let’s gather strength and move upward together ✨
#BTC #ETH #比特币现货ETF结束9日净流入
$BTC $ETH $SOL


The summer story comes to a close,
September arrives with the autumn breeze as promised 🍃
Hand your hopes to the passage of time,
May the wind meet with gentleness, and may people meet with good luck. ☘️
#MichaelSaylor暗示增持BTC #俄罗斯9月1日启动数字卢布大规模推广 #BTC #ETH ☕️☕️🔥🔥🔥
$BTC $ETH $SOL
September arrives with the autumn breeze as promised 🍃
Hand your hopes to the passage of time,
May the wind meet with gentleness, and may people meet with good luck. ☘️
#MichaelSaylor暗示增持BTC #俄罗斯9月1日启动数字卢布大规模推广 #BTC #ETH ☕️☕️🔥🔥🔥
$BTC $ETH $SOL

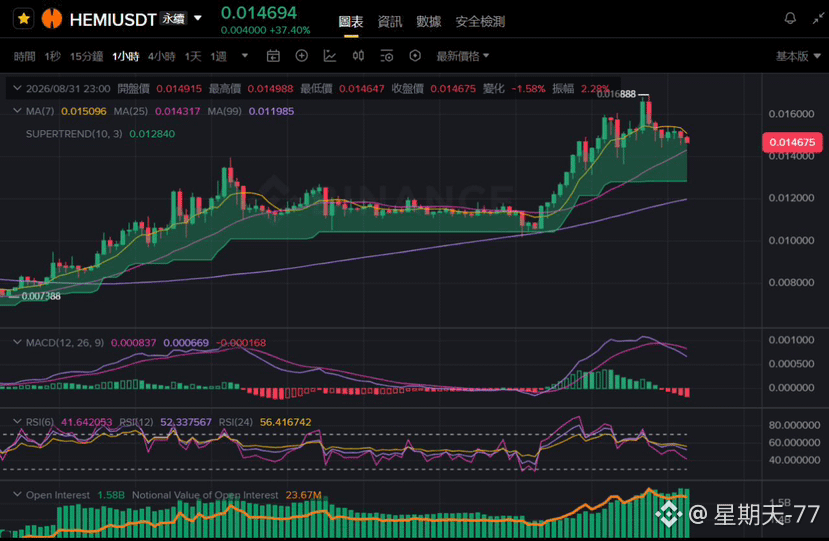
$HEMI 0.014694, single-day explosive surge up 37%. It surged and peaked, then started cooling down
Current price: 0.014694. Today’s high reached 0.016888. The intraday range is huge—this is a typical short-term pump-and-dump style move. MA7 (0.015096) has already crossed above MA25 (0.014317) and MA99 (0.011985). SUPERTREND is at 0.012840, and the entire moving-average system is aligned bullishly. The overall trend hasn’t turned bad.
However, short-term signals are already diverging. RSI6 has fallen to 41.64 and has broken below the 50 midline, while RSI24 is still at 56.42. The long-cycle remains relatively strong, but the short cycle has started weakening—this is the classic structure of “after a spike, short-term cools off, long-term trend not broken.” MACD histogram has turned from green to red; the spread between DIF and DEA has narrowed to -0.000168. After the golden cross, momentum is clearly fading.
Open Interest is worth paying attention to: 1.58B is still rising on expanding volume. Even though price has pulled back from the highs, OI hasn’t decreased in sync. This suggests the leverage accumulated in this surge hasn’t been fully flushed out—what’s inside may be new short positions entering the game, or longs holding positions and waiting for a later cover.
With an intraday 37% rally, the cost-effectiveness of chasing is already very low. In the short term, expect consolidation in the range 0.014647–0.014988 to digest the move. If it breaks below MA25 (0.014317) and the rebound fails to reclaim that level, it’s likely to retest the prior range/platform. If it can stabilize within this zone and OI continues to rise, then it would be reasonable to look for a new breakout above 0.016888.
At this point, watching from the sidelines is safer than acting.
⚠️ The above is my personal interpretation of technical indicators and does not constitute investment advice.
#MichaelSaylor暗示增持BTC #sol #solana #比特币8月上涨23%跑赢黄金股市 $BTC $ETH
Current price: 0.014694. Today’s high reached 0.016888. The intraday range is huge—this is a typical short-term pump-and-dump style move. MA7 (0.015096) has already crossed above MA25 (0.014317) and MA99 (0.011985). SUPERTREND is at 0.012840, and the entire moving-average system is aligned bullishly. The overall trend hasn’t turned bad.
However, short-term signals are already diverging. RSI6 has fallen to 41.64 and has broken below the 50 midline, while RSI24 is still at 56.42. The long-cycle remains relatively strong, but the short cycle has started weakening—this is the classic structure of “after a spike, short-term cools off, long-term trend not broken.” MACD histogram has turned from green to red; the spread between DIF and DEA has narrowed to -0.000168. After the golden cross, momentum is clearly fading.
Open Interest is worth paying attention to: 1.58B is still rising on expanding volume. Even though price has pulled back from the highs, OI hasn’t decreased in sync. This suggests the leverage accumulated in this surge hasn’t been fully flushed out—what’s inside may be new short positions entering the game, or longs holding positions and waiting for a later cover.
With an intraday 37% rally, the cost-effectiveness of chasing is already very low. In the short term, expect consolidation in the range 0.014647–0.014988 to digest the move. If it breaks below MA25 (0.014317) and the rebound fails to reclaim that level, it’s likely to retest the prior range/platform. If it can stabilize within this zone and OI continues to rise, then it would be reasonable to look for a new breakout above 0.016888.
At this point, watching from the sidelines is safer than acting.
⚠️ The above is my personal interpretation of technical indicators and does not constitute investment advice.
#MichaelSaylor暗示增持BTC #sol #solana #比特币8月上涨23%跑赢黄金股市 $BTC $ETH
September

星禾-66
·
--
Comment section: leave “September luck,”
let the rest be handled by metaphysics.🧧
#BTC #ETH #zec #黄金本周下跌3.24% 🔥
$ETH $BTC
let the rest be handled by metaphysics.🧧
#BTC #ETH #zec #黄金本周下跌3.24% 🔥
$ETH $BTC

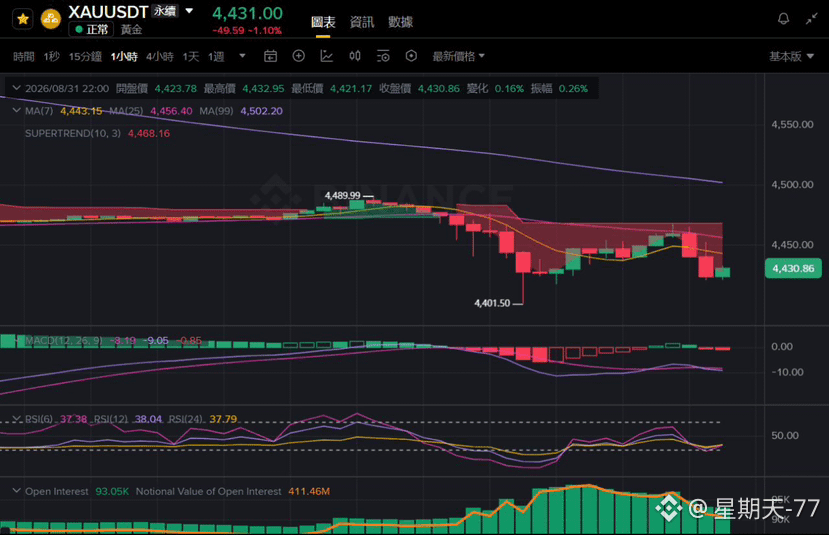
Gold fell from 4,489 to 4,401, but open interest kept rising over the same period. Shorts added to positions on real gold and silver.
Current price: 4,431.00, down 1.10% over the past 24 hours. In the first 1-hour period today: open 4,423.78, high 4,432.95, close 4,430.86. The amplitude is 0.26%, and it has rebounded slightly from the low point.
The starting point of this pullback was the 4,489.99 high, which then dropped to 4,401.50 where selling pressure eased. MA7/25/99 are 4,443.15, 4,456.40, and 4,502.20; the price is entirely below the moving averages. The super trend line at 4,468.16 is also acting as resistance, and the structure is bearish.
Notably, open interest is rising at the same time. It is now 93.05K, with notional value of 411.46M. This suggests that while the price is falling, new positions are being added—more like shorts are increasing their exposure rather than longs closing and exiting. RSI is 37.38, 38.04, and 37.79, nearly stuck together: bearish, but not yet reaching an oversold extreme. The MACD histogram remains negative.
Open interest and price move in opposite directions. This indicates funding sentiment better than looking at the candlestick chart alone.
Do you think this gold price move will first test the bottom at 4,400, or first rebound?
My personal view only; not investment advice.
#XAU #BTC #SK海力士研究在日本合建存储芯片厂 #MichaelSaylor暗示增持BTC $ETH $BTC $XAU
Current price: 4,431.00, down 1.10% over the past 24 hours. In the first 1-hour period today: open 4,423.78, high 4,432.95, close 4,430.86. The amplitude is 0.26%, and it has rebounded slightly from the low point.
The starting point of this pullback was the 4,489.99 high, which then dropped to 4,401.50 where selling pressure eased. MA7/25/99 are 4,443.15, 4,456.40, and 4,502.20; the price is entirely below the moving averages. The super trend line at 4,468.16 is also acting as resistance, and the structure is bearish.
Notably, open interest is rising at the same time. It is now 93.05K, with notional value of 411.46M. This suggests that while the price is falling, new positions are being added—more like shorts are increasing their exposure rather than longs closing and exiting. RSI is 37.38, 38.04, and 37.79, nearly stuck together: bearish, but not yet reaching an oversold extreme. The MACD histogram remains negative.
Open interest and price move in opposite directions. This indicates funding sentiment better than looking at the candlestick chart alone.
Do you think this gold price move will first test the bottom at 4,400, or first rebound?
My personal view only; not investment advice.
#XAU #BTC #SK海力士研究在日本合建存储芯片厂 #MichaelSaylor暗示增持BTC $ETH $BTC $XAU
Partly True
The moment Jackson Hole opened its mouth, Waller pushed the September rate-hike probability from 35% straight to 60%
Waller’s speech at Jackson Hole on August 27 was his most complete articulation of his hawkish stance this year: the 2% inflation target remains unwavering; current financial conditions cannot be said to be restrictive enough; and the recent PCE and CPI data are also insufficient to show that core inflation has meaningfully improved. The market reaction was very direct. Two-year U.S. Treasury yields jumped 12 basis points in a single day to 4.35%, and federal funds futures showed the September rate-hike probability rising from about 35% before the speech to beyond 50%, now approaching 60%.
This week is the key window to test whether these hawkish remarks can actually be implemented. Monday’s PMI, Wednesday’s ADP, Thursday’s Beige Book, and early Friday morning a speech by Cleveland Fed President Mester, with the evening’s finale being the August Nonfarm Payrolls jobs report and unemployment rate. Last month’s Nonfarm Payrolls badly missed expectations, triggering a round of sharp asset volatility. This time, the data carries even more weight.
Tensions within the Federal Reserve have also not disappeared. Kashkari and Cook favor starting gradual rate hikes sooner, with the earliest possible implementation in September. Williams, meanwhile, emphasized that action would be needed only if inflation fails to ease as expected—his stance is more cautious.
Waller’s real test has shifted from “whether the market understood his remarks” to “whether the data cooperates so he can turn his diagnosis into action.”
Do you think this Nonfarm Payrolls report will come in strong enough to support a direct rate hike in September?
Personal opinion only; not investment advice.
#非农就业数据 $SOL $ETH $BTC
#沃什称通胀是美联储首要关注 #美联储何时降息?
Waller’s speech at Jackson Hole on August 27 was his most complete articulation of his hawkish stance this year: the 2% inflation target remains unwavering; current financial conditions cannot be said to be restrictive enough; and the recent PCE and CPI data are also insufficient to show that core inflation has meaningfully improved. The market reaction was very direct. Two-year U.S. Treasury yields jumped 12 basis points in a single day to 4.35%, and federal funds futures showed the September rate-hike probability rising from about 35% before the speech to beyond 50%, now approaching 60%.
This week is the key window to test whether these hawkish remarks can actually be implemented. Monday’s PMI, Wednesday’s ADP, Thursday’s Beige Book, and early Friday morning a speech by Cleveland Fed President Mester, with the evening’s finale being the August Nonfarm Payrolls jobs report and unemployment rate. Last month’s Nonfarm Payrolls badly missed expectations, triggering a round of sharp asset volatility. This time, the data carries even more weight.
Tensions within the Federal Reserve have also not disappeared. Kashkari and Cook favor starting gradual rate hikes sooner, with the earliest possible implementation in September. Williams, meanwhile, emphasized that action would be needed only if inflation fails to ease as expected—his stance is more cautious.
Waller’s real test has shifted from “whether the market understood his remarks” to “whether the data cooperates so he can turn his diagnosis into action.”
Do you think this Nonfarm Payrolls report will come in strong enough to support a direct rate hike in September?
Personal opinion only; not investment advice.
#非农就业数据 $SOL $ETH $BTC
#沃什称通胀是美联储首要关注 #美联储何时降息?

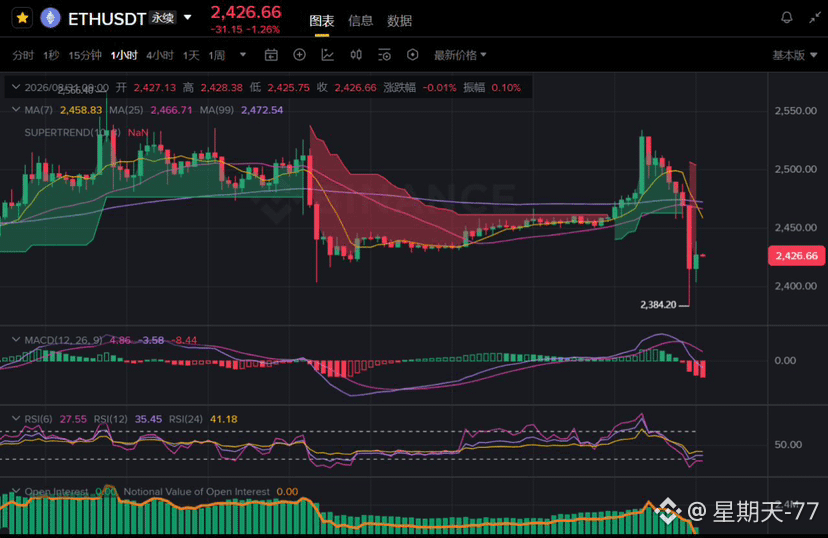
$ETH broke below the prior low 2,386, then probed to 2,384.20, and is now rebounding to 2,426, still below the moving averages.
Current price: 2,426.66, down 1.26% over the past 24 hours. Today’s 1-hour candle opened at 2,427.13, high 2,428.38, low 2,425.75, and closed at 2,426.66; change -0.01%. The intraday range is only 0.10%, with price nearly going nowhere.
This latest swing low pushed a bit lower: it refreshed from the prior 2,386.00 down to 2,384.20, suggesting selling pressure hasn’t fully been released. MA7, 25, and 99 are 2,458.83, 2,466.71, and 2,472.54 respectively, and the price remains below all three moving averages—the structure is still relatively weak.
MACD readings are 4.86, -3.58, and -8.44; the histogram has already turned negative. RSI’s three lines are 27.55 (6-day), 35.45 (12-day), and 41.18 (24-day). The short-term cycle has already dropped into the slightly oversold zone, but the 24-day RSI hasn’t reached extreme levels yet.
As long as it can’t reclaim 2,458 (MA7), this rebound looks more like weak consolidation rather than a trend reversal.
Do you think it will first break below 2,384, or manage to reclaim 2,458 first?
For personal opinion only; not investment advice.
#比特币现货ETF结束9日净流入 #首笔抗量子比特币交易主网完成 #ETH #特朗普达成委内瑞拉17油田开发协议 $BTC $SOL
Current price: 2,426.66, down 1.26% over the past 24 hours. Today’s 1-hour candle opened at 2,427.13, high 2,428.38, low 2,425.75, and closed at 2,426.66; change -0.01%. The intraday range is only 0.10%, with price nearly going nowhere.
This latest swing low pushed a bit lower: it refreshed from the prior 2,386.00 down to 2,384.20, suggesting selling pressure hasn’t fully been released. MA7, 25, and 99 are 2,458.83, 2,466.71, and 2,472.54 respectively, and the price remains below all three moving averages—the structure is still relatively weak.
MACD readings are 4.86, -3.58, and -8.44; the histogram has already turned negative. RSI’s three lines are 27.55 (6-day), 35.45 (12-day), and 41.18 (24-day). The short-term cycle has already dropped into the slightly oversold zone, but the 24-day RSI hasn’t reached extreme levels yet.
As long as it can’t reclaim 2,458 (MA7), this rebound looks more like weak consolidation rather than a trend reversal.
Do you think it will first break below 2,384, or manage to reclaim 2,458 first?
For personal opinion only; not investment advice.
#比特币现货ETF结束9日净流入 #首笔抗量子比特币交易主网完成 #ETH #特朗普达成委内瑞拉17油田开发协议 $BTC $SOL
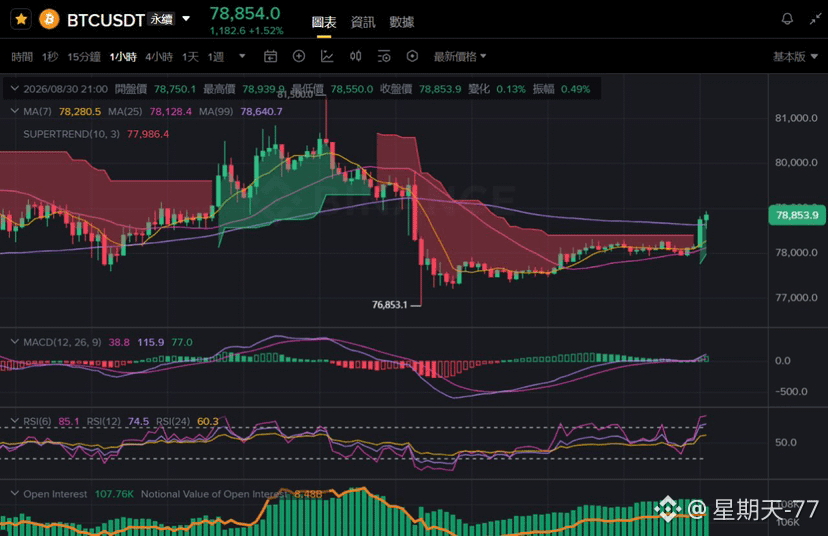
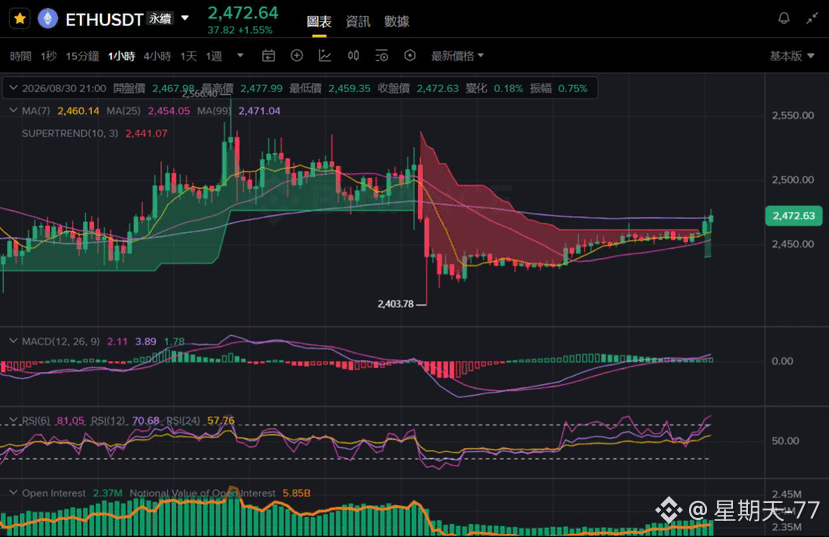
$BTC surged to 78,939 then pulled back to close at 78,854. $ETH simultaneously touched 2,478 and then retreated to 2,473 as well. The rhythm of this “catch-up rally” is quite consistent.
Current price BTC 78,854.0, up 1.52% in 24 hours; ETH 2,472.64, up 1.55% in 24 hours—both gains are almost in lockstep. On the 1-hour candle today: BTC opened at 78,750.1, high at 78,939.9, and closed at 78,853.9, with a range of 0.49%. ETH opened at 2,467.98, high at 2,477.99, and closed at 2,472.63, with a range of 0.75%—ETH’s volatility has once again been larger as usual.
Looking at the bigger structure, both are playing the same script: after BTC stabilized around 76,853.1, it climbed back in a stepwise fashion; ETH also repaired in sync from the low of 2,403.78. This suggests the move is a coordinated catch-up, not an independent single-coin trend.
Technically, for BTC, RSI6 is 85.1 while RSI24 is only 60.3—hot on the short cycle, restrained on the long cycle. ETH is even more extreme: RSI6 at 81.05 and RSI24 at 57.76. The MACD on both sides has positive bars expanding, and the momentum direction is consistent. In positioning, BTC’s Open Interest is 107.76K (nominal 8.48B), and ETH is 2.37M (nominal 5.85B). Both sides are following the rise—no one-sided sell pressure.
As long as BTC doesn’t break below 77,986.4 and ETH doesn’t break below 2,441.07—these two super trend lines—this coordinated catch-up structure is still relatively healthy.
Do you think this time BTC will break above the previous high first, or will ETH run out an independent trend first?
For personal opinion only and does not constitute investment advice.
#BTC #ETH #比特币现货ETF结束9日净流入 #首笔抗量子比特币交易主网完成 $SNDK
Current price BTC 78,854.0, up 1.52% in 24 hours; ETH 2,472.64, up 1.55% in 24 hours—both gains are almost in lockstep. On the 1-hour candle today: BTC opened at 78,750.1, high at 78,939.9, and closed at 78,853.9, with a range of 0.49%. ETH opened at 2,467.98, high at 2,477.99, and closed at 2,472.63, with a range of 0.75%—ETH’s volatility has once again been larger as usual.
Looking at the bigger structure, both are playing the same script: after BTC stabilized around 76,853.1, it climbed back in a stepwise fashion; ETH also repaired in sync from the low of 2,403.78. This suggests the move is a coordinated catch-up, not an independent single-coin trend.
Technically, for BTC, RSI6 is 85.1 while RSI24 is only 60.3—hot on the short cycle, restrained on the long cycle. ETH is even more extreme: RSI6 at 81.05 and RSI24 at 57.76. The MACD on both sides has positive bars expanding, and the momentum direction is consistent. In positioning, BTC’s Open Interest is 107.76K (nominal 8.48B), and ETH is 2.37M (nominal 5.85B). Both sides are following the rise—no one-sided sell pressure.
As long as BTC doesn’t break below 77,986.4 and ETH doesn’t break below 2,441.07—these two super trend lines—this coordinated catch-up structure is still relatively healthy.
Do you think this time BTC will break above the previous high first, or will ETH run out an independent trend first?
For personal opinion only and does not constitute investment advice.
#BTC #ETH #比特币现货ETF结束9日净流入 #首笔抗量子比特币交易主网完成 $SNDK
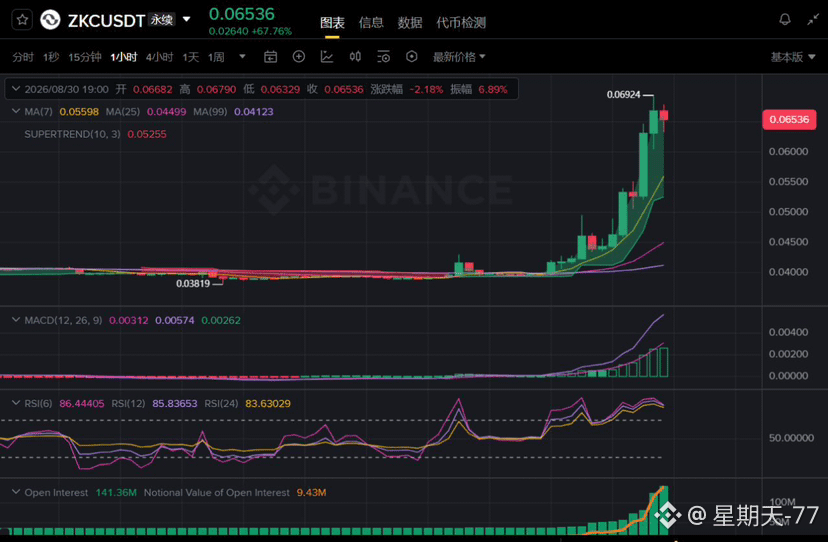
$ZKC from 0.03819 to 0.06536—up nearly 70%. The position size also exploded along with it. I’d rather watch the show than get on this train.
During the period, the rise/fall is +67.76%. The low was 0.03819 and it surged to a high of 0.06924. It closed at 0.06536 today. In the last 4 hours: open 0.06682, high 0.06790, low 0.06329, and it closed down 2.18%. The intraday range is nearly 7 points. MA7 is only 0.05598, which is far stretched from the price. It never pulled back even once and just kept charging upward.
The sub-chart is even more frightening: RSI6, 12, and 24 are 86.44, 85.84, and 83.63 respectively—all are deeply overbought. More importantly, Open Interest has reached 141.36M, and with the candlesticks it’s rising on increased volume, indicating that new leveraged funds are still pouring in.
When you have a sharp price jump + indicators overbought + position size exploding at the same time, I personally wouldn’t chase longs at this spot. I’d rather wait for it to cool down first.
This is only my personal opinion and does not constitute investment advice.
#ZKC #比特币现货ETF结束9日净流入 #首笔抗量子比特币交易主网完成 #特朗普达成委内瑞拉17油田开发协议 $ETH $BTC
During the period, the rise/fall is +67.76%. The low was 0.03819 and it surged to a high of 0.06924. It closed at 0.06536 today. In the last 4 hours: open 0.06682, high 0.06790, low 0.06329, and it closed down 2.18%. The intraday range is nearly 7 points. MA7 is only 0.05598, which is far stretched from the price. It never pulled back even once and just kept charging upward.
The sub-chart is even more frightening: RSI6, 12, and 24 are 86.44, 85.84, and 83.63 respectively—all are deeply overbought. More importantly, Open Interest has reached 141.36M, and with the candlesticks it’s rising on increased volume, indicating that new leveraged funds are still pouring in.
When you have a sharp price jump + indicators overbought + position size exploding at the same time, I personally wouldn’t chase longs at this spot. I’d rather wait for it to cool down first.
This is only my personal opinion and does not constitute investment advice.
#ZKC #比特币现货ETF结束9日净流入 #首笔抗量子比特币交易主网完成 #特朗普达成委内瑞拉17油田开发协议 $ETH $BTC
Verified
Three things next week may be more important than price lines
Next week’s market will be driven by the U.S. nonfarm payrolls report, the G20 meeting of finance ministers and central bank governors, and the Federal Reserve’s release of the Beige Book. The August nonfarm payrolls data published on Friday—before the Fed’s September 16 policy meeting—will test expectations for a September rate hike. A Reuters poll expects August nonfarm payrolls to add 58,000 jobs, with the unemployment rate steady at 4.1% and average hourly earnings up 0.2% month over month. If the data weakens, markets may reassess the urgency of further rate hikes; if it shows resilience, expectations of a hike will be further solidified. Currently, the probability of a September rate hike is close to 60%, and it is above 90% before December.
In terms of key events, on Tuesday at 21:45 (Beijing time) the global and U.S. ISM Manufacturing PMI will be released; on Wednesday, ADP employment and Canada’s interest-rate decision (expected to hold at 2.25%); on Thursday, the Beige Book, initial jobless claims, and a speech/interview by Waller; on Friday, besides nonfarm payrolls, there will also be remarks by FOMC voter Hammack. The G20 meeting of finance ministers and central bank governors is being held concurrently in Asheville, North Carolina, marking yet another concentrated appearance following the Jackson Hole symposium.
On the earnings front, Dell will report Q2 results after the close on Tuesday, expected earnings per share of $4.91. Broadcom will release Q3 results after the close on Wednesday, expected revenue of $29.4 billion and EPS of $3.24, further validating demand for AI servers and networking equipment.
With nonfarm payrolls setting the tone for sentiment, central banks setting the direction, and AI earnings guiding capital flows, these three lines intertwine to shape next week’s risk appetite.
#非农就业数据 #加密市场回调 #首笔抗量子比特币交易主网完成 #btc $SNDK $ETH $BTC
Next week’s market will be driven by the U.S. nonfarm payrolls report, the G20 meeting of finance ministers and central bank governors, and the Federal Reserve’s release of the Beige Book. The August nonfarm payrolls data published on Friday—before the Fed’s September 16 policy meeting—will test expectations for a September rate hike. A Reuters poll expects August nonfarm payrolls to add 58,000 jobs, with the unemployment rate steady at 4.1% and average hourly earnings up 0.2% month over month. If the data weakens, markets may reassess the urgency of further rate hikes; if it shows resilience, expectations of a hike will be further solidified. Currently, the probability of a September rate hike is close to 60%, and it is above 90% before December.
In terms of key events, on Tuesday at 21:45 (Beijing time) the global and U.S. ISM Manufacturing PMI will be released; on Wednesday, ADP employment and Canada’s interest-rate decision (expected to hold at 2.25%); on Thursday, the Beige Book, initial jobless claims, and a speech/interview by Waller; on Friday, besides nonfarm payrolls, there will also be remarks by FOMC voter Hammack. The G20 meeting of finance ministers and central bank governors is being held concurrently in Asheville, North Carolina, marking yet another concentrated appearance following the Jackson Hole symposium.
On the earnings front, Dell will report Q2 results after the close on Tuesday, expected earnings per share of $4.91. Broadcom will release Q3 results after the close on Wednesday, expected revenue of $29.4 billion and EPS of $3.24, further validating demand for AI servers and networking equipment.
With nonfarm payrolls setting the tone for sentiment, central banks setting the direction, and AI earnings guiding capital flows, these three lines intertwine to shape next week’s risk appetite.
#非农就业数据 #加密市场回调 #首笔抗量子比特币交易主网完成 #btc $SNDK $ETH $BTC
Everyone is watching the $80,000 "new high"—no one is watching the RSI quietly making fresh lows
This technical analysis from Rekt Capital is definitely worth thinking about: Bitcoin’s February 2026 and June 2026 stage lows line up almost perfectly in price, and the RSI oversold levels are also nearly identical—textbook “double bottom.” But when you zoom in on the high end, it doesn’t hold up. Compared with the May high, this rebound really did set a new high and even tested around $80,000, yet the RSI’s overbought strength is clearly weaker. Higher price, weaker momentum—that’s a classic hidden bearish divergence. So $80,000 isn’t just a psychological integer level, but a psychological resistance zone where this divergence can—or can’t—be invalidated.
The liquidation chart provides another layer of confirmation. According to Coinglass, if BTC breaks above $80,000, the total liquidation intensity of mainstream CEX short positions would reach 619 million; but if it falls below $76,000, the liquidation intensity of long positions would be 661 million. In other words, there are more shorts stacked overhead, and longs aren’t doing great either below—this week looks more like a two-way minefield than a one-directional trend.
The real variable may be outside the chart. Next week features Non-Farm Payrolls (the last report before the September 16 rate decision), the G20 central bank governors’ meeting, and Broadcom/DeLL AI earnings all in the same week. Weakness in the NFP would reinforce expectations for “slower rate hikes,” while the AI capex storyline (with Nvidia’s valuation still considered possibly undervalued by Tom Lee, and Dell/AMD/Broadcom orders validating demand) if it keeps strengthening could raise the linkage risk between dollar liquidity and high-multiple assets—more than the $80,000 line itself.
Personal opinion only, not investment advice.
#比特币 #BTC #非农就业数据 #首笔抗量子比特币交易主网完成 $ZEC $ETH $BTC
This technical analysis from Rekt Capital is definitely worth thinking about: Bitcoin’s February 2026 and June 2026 stage lows line up almost perfectly in price, and the RSI oversold levels are also nearly identical—textbook “double bottom.” But when you zoom in on the high end, it doesn’t hold up. Compared with the May high, this rebound really did set a new high and even tested around $80,000, yet the RSI’s overbought strength is clearly weaker. Higher price, weaker momentum—that’s a classic hidden bearish divergence. So $80,000 isn’t just a psychological integer level, but a psychological resistance zone where this divergence can—or can’t—be invalidated.
The liquidation chart provides another layer of confirmation. According to Coinglass, if BTC breaks above $80,000, the total liquidation intensity of mainstream CEX short positions would reach 619 million; but if it falls below $76,000, the liquidation intensity of long positions would be 661 million. In other words, there are more shorts stacked overhead, and longs aren’t doing great either below—this week looks more like a two-way minefield than a one-directional trend.
The real variable may be outside the chart. Next week features Non-Farm Payrolls (the last report before the September 16 rate decision), the G20 central bank governors’ meeting, and Broadcom/DeLL AI earnings all in the same week. Weakness in the NFP would reinforce expectations for “slower rate hikes,” while the AI capex storyline (with Nvidia’s valuation still considered possibly undervalued by Tom Lee, and Dell/AMD/Broadcom orders validating demand) if it keeps strengthening could raise the linkage risk between dollar liquidity and high-multiple assets—more than the $80,000 line itself.
Personal opinion only, not investment advice.
#比特币 #BTC #非农就业数据 #首笔抗量子比特币交易主网完成 $ZEC $ETH $BTC
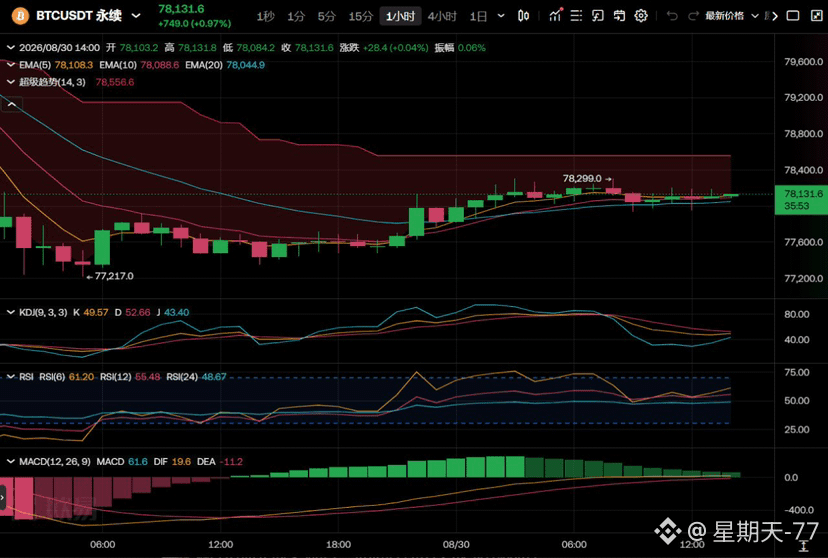
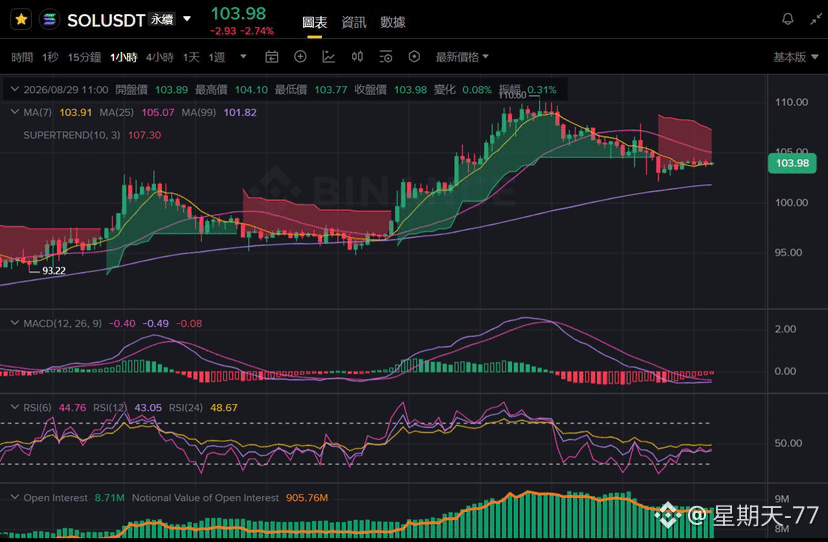
$SOL callback to 104, yet the position size is still at a high level and hasn’t been reduced; on-chain big whales are also acting in sync
Current price 103.98, down 2.74% over the past 24 hours. After falling all the way from the prior high at 110.60, it broke below MA7 (103.91). Price is trading just below MA25 (105.07), and the Super Trend line at 107.30 is capping from above. From the chart, we can see that this rally that started at 93.22 has gone through two phases of upswing, with one deep pullback in between. Now it’s the second high-level pullback, and the slope is a bit steeper than the prior wave.
Open interest is currently 8.71M coins, with a notional value of $905.76M. From the chart, this round of open interest has been steadily rising to a high level and then holding there; it hasn’t shrunk noticeably alongside the price pullback. This detail is worth noting—if in-market capital were truly panic-selling and exiting, open interest would usually drop rapidly together with price. But right now, the price is down while open interest hasn’t moved much, suggesting most positions are staying on-exchange to watch rather than cutting losses and leaving.
This matches the on-chain whale activity at the same time. According to Lookonchain monitoring, address 5p6zPz withdrew 281,446 SOL from Binance about 9 hours ago, worth approximately $29.68M; another address 3WzfuP withdrew 37,272 SOL from Kraken about 1 hour ago, worth approximately $3.87M. Together, that’s $33.55M. Large on-chain withdrawals typically mean they don’t plan to sell in the short term; they’re more inclined to hold long-term or participate in staking. It’s the same type of signal as the open interest staying elevated on the derivatives side.
On the technical side, the MACD histogram is still negative but narrowing. The DIF line at -0.49 is moving toward the DEA line at -0.08, and the rate at which momentum is fading has slowed down. The RSI three lines are stabilizing in the 43–48 range, which is typical of a sideways base-building pattern—there’s no strong signal for further downside for now.
With positions in the market not being reduced and on-chain whales accumulating, both clues point in the same direction: this pullback looks more like positions waiting through disagreement rather than the start of a trend reversal. Of course, sentiment-based factors are only reference; the real path still depends on whether price can regain and hold above MA7.
After this pullback, do you think SOL will form a more solid bottom?
For personal opinion only and does not constitute investment advice. #sol #solana #SOL本周上涨20% $BTC $ETH
Current price 103.98, down 2.74% over the past 24 hours. After falling all the way from the prior high at 110.60, it broke below MA7 (103.91). Price is trading just below MA25 (105.07), and the Super Trend line at 107.30 is capping from above. From the chart, we can see that this rally that started at 93.22 has gone through two phases of upswing, with one deep pullback in between. Now it’s the second high-level pullback, and the slope is a bit steeper than the prior wave.
Open interest is currently 8.71M coins, with a notional value of $905.76M. From the chart, this round of open interest has been steadily rising to a high level and then holding there; it hasn’t shrunk noticeably alongside the price pullback. This detail is worth noting—if in-market capital were truly panic-selling and exiting, open interest would usually drop rapidly together with price. But right now, the price is down while open interest hasn’t moved much, suggesting most positions are staying on-exchange to watch rather than cutting losses and leaving.
This matches the on-chain whale activity at the same time. According to Lookonchain monitoring, address 5p6zPz withdrew 281,446 SOL from Binance about 9 hours ago, worth approximately $29.68M; another address 3WzfuP withdrew 37,272 SOL from Kraken about 1 hour ago, worth approximately $3.87M. Together, that’s $33.55M. Large on-chain withdrawals typically mean they don’t plan to sell in the short term; they’re more inclined to hold long-term or participate in staking. It’s the same type of signal as the open interest staying elevated on the derivatives side.
On the technical side, the MACD histogram is still negative but narrowing. The DIF line at -0.49 is moving toward the DEA line at -0.08, and the rate at which momentum is fading has slowed down. The RSI three lines are stabilizing in the 43–48 range, which is typical of a sideways base-building pattern—there’s no strong signal for further downside for now.
With positions in the market not being reduced and on-chain whales accumulating, both clues point in the same direction: this pullback looks more like positions waiting through disagreement rather than the start of a trend reversal. Of course, sentiment-based factors are only reference; the real path still depends on whether price can regain and hold above MA7.
After this pullback, do you think SOL will form a more solid bottom?
For personal opinion only and does not constitute investment advice. #sol #solana #SOL本周上涨20% $BTC $ETH
Machi Big Brother’s long positions keep being topped up, but this time he also absorbed a real loss
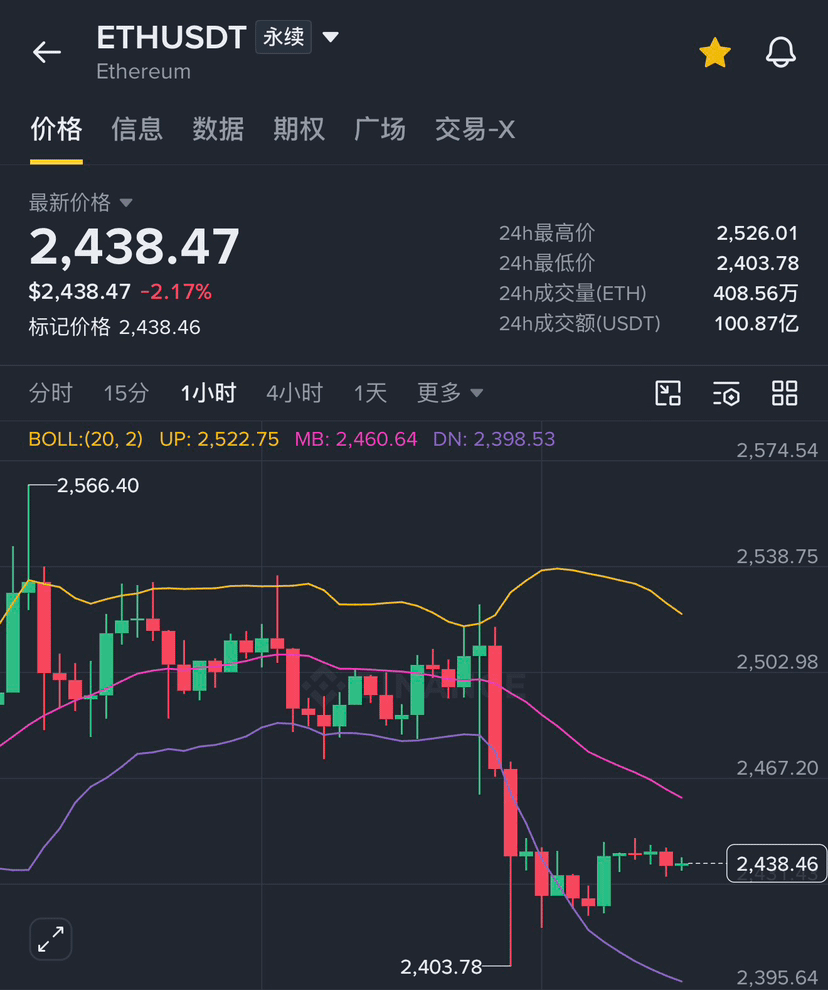
According to monitoring by TradingBeats (formerly Hyperinsight), “Machi Big Brother” Huang Licheng’s address still currently holds about 41,000 ETH, worth roughly $100 million—making it the largest on-chain ETH long position by current size. As the market pulled back, Machi about 7 hours ago closed part of his ETH longs, realizing a loss of approximately $1.96 million.
His wallet’s main holdings currently include: 41,000 ETH ($ETH ) (about $100.01 million), 75,000 HYPE (about $6.03 million), and 45 BTC (about $3.5 million). Combined, the three positions are worth more than $110 million—one of the few on-chain whales whose size is large enough to be analyzed in isolation.
This is the same ongoing thread as what was mentioned earlier about him “slightly reducing ETH longs to take profit,” but this time the roles reverse—from taking profit to cutting at a loss. Last time he actively cashed out; the remaining position still had about $1.59 million in unrealized profit. This time, however, it was the market pullback that forced him to trim, and the loss was a concrete $1.96 million. Put together, these two moves show that even the largest on-chain long holder isn’t “winning forever.” Position management still has to follow market conditions.
Worth noting is that he did not clear his ETH holdings. His core long position of 41,000 ETH remains, indicating this is not a turning point in trend judgment—it’s more like routine adjustments to a leveraged position: controlling risk exposure by closing part of the position, rather than outright going bearish.
This also indirectly reinforces a principle: the size of holdings by on-chain whales and the “making a fortune” myths they spark can easily create the illusion of “copying trades guarantees easy profits.” But the normal state for leveraged longs is that they go up and down. Stories of surviving 500 liquidations and turning around are rare; in most cases, positions like this experience the same kind of unrealized profit-and-loss fluctuations as ordinary traders.
#麻吉 #ETH #黄金8月上涨约14% #BTC #SOL本周上涨20% $BTC $SOL
According to monitoring by TradingBeats (formerly Hyperinsight), “Machi Big Brother” Huang Licheng’s address still currently holds about 41,000 ETH, worth roughly $100 million—making it the largest on-chain ETH long position by current size. As the market pulled back, Machi about 7 hours ago closed part of his ETH longs, realizing a loss of approximately $1.96 million.
His wallet’s main holdings currently include: 41,000 ETH ($ETH ) (about $100.01 million), 75,000 HYPE (about $6.03 million), and 45 BTC (about $3.5 million). Combined, the three positions are worth more than $110 million—one of the few on-chain whales whose size is large enough to be analyzed in isolation.
This is the same ongoing thread as what was mentioned earlier about him “slightly reducing ETH longs to take profit,” but this time the roles reverse—from taking profit to cutting at a loss. Last time he actively cashed out; the remaining position still had about $1.59 million in unrealized profit. This time, however, it was the market pullback that forced him to trim, and the loss was a concrete $1.96 million. Put together, these two moves show that even the largest on-chain long holder isn’t “winning forever.” Position management still has to follow market conditions.
Worth noting is that he did not clear his ETH holdings. His core long position of 41,000 ETH remains, indicating this is not a turning point in trend judgment—it’s more like routine adjustments to a leveraged position: controlling risk exposure by closing part of the position, rather than outright going bearish.
This also indirectly reinforces a principle: the size of holdings by on-chain whales and the “making a fortune” myths they spark can easily create the illusion of “copying trades guarantees easy profits.” But the normal state for leveraged longs is that they go up and down. Stories of surviving 500 liquidations and turning around are rare; in most cases, positions like this experience the same kind of unrealized profit-and-loss fluctuations as ordinary traders.
#麻吉 #ETH #黄金8月上涨约14% #BTC #SOL本周上涨20% $BTC $SOL

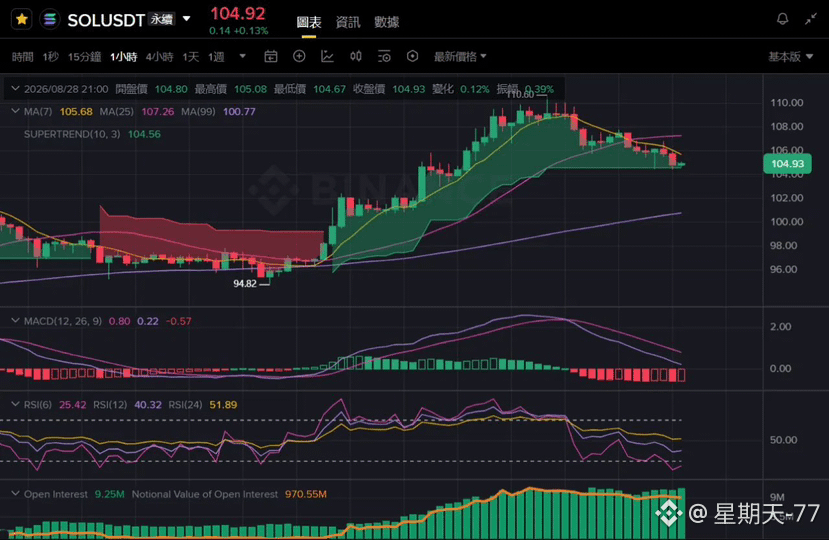
$SOL This week is up 20%, now it’s at the crossroads where you have to decide whether to chase
Current price is 104.92. This week’s cumulative gain is 20%. It’s one of the most standout performers in this round of altcoin rebounds. It stepped up from the low of 94.82 to the previous high of 110.60 in a fairly steep, stair-step climb. After that, several consecutive bearish candles pulled back to consolidate around the current 104.
What’s interesting is that the open interest has been steadily rising during this period. From the chart, it’s already climbed to 9.25M units, with a notional value of $970.55M. This suggests the rally wasn’t a “volume-less” spike; there is real capital continuously entering and adding positions. It’s not just a pure sentiment-driven trade.
However, the technicals are already signaling a cooldown: RSI6 is down to 25.42, and RSI12 is 40.32—clearly weaker in the short term. The MACD histogram has flipped from green to red, and momentum has been fading since the peak. Price is currently sitting below MA7 (105.68). The Supertrend line around 104.56 has become the near-term line separating bulls and bears.
This kind of “violent rally followed by a lower-volume pullback” is something that the most aggressively up coins this week commonly go through. It doesn’t mean the trend has ended, but the risk-reward for chasing at current levels has noticeably worsened in the short term. Holding the 104.56 line is the key.
This week is up 20%—do you think SOL can still run up again next week?
For personal opinion only and does not constitute investment advice.
#sol #solana #SOL本周上涨20% #英伟达开盘140分钟成交335亿美元 $BTC $NVDA
Current price is 104.92. This week’s cumulative gain is 20%. It’s one of the most standout performers in this round of altcoin rebounds. It stepped up from the low of 94.82 to the previous high of 110.60 in a fairly steep, stair-step climb. After that, several consecutive bearish candles pulled back to consolidate around the current 104.
What’s interesting is that the open interest has been steadily rising during this period. From the chart, it’s already climbed to 9.25M units, with a notional value of $970.55M. This suggests the rally wasn’t a “volume-less” spike; there is real capital continuously entering and adding positions. It’s not just a pure sentiment-driven trade.
However, the technicals are already signaling a cooldown: RSI6 is down to 25.42, and RSI12 is 40.32—clearly weaker in the short term. The MACD histogram has flipped from green to red, and momentum has been fading since the peak. Price is currently sitting below MA7 (105.68). The Supertrend line around 104.56 has become the near-term line separating bulls and bears.
This kind of “violent rally followed by a lower-volume pullback” is something that the most aggressively up coins this week commonly go through. It doesn’t mean the trend has ended, but the risk-reward for chasing at current levels has noticeably worsened in the short term. Holding the 104.56 line is the key.
This week is up 20%—do you think SOL can still run up again next week?
For personal opinion only and does not constitute investment advice.
#sol #solana #SOL本周上涨20% #英伟达开盘140分钟成交335亿美元 $BTC $NVDA
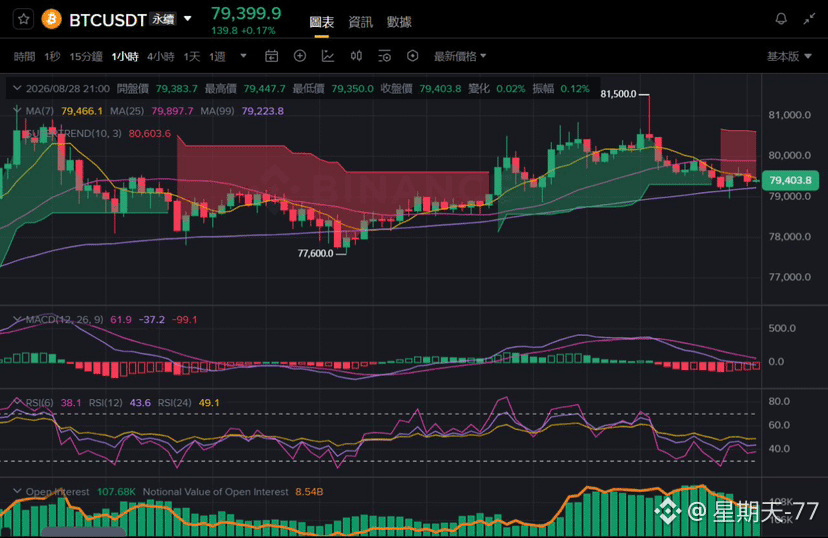
$BTC 踩整理,holdings volume surges against the trend
Current price 79,399.9, up 0.17% over the past 24 hours. The high touched 81,500.0, then followed by consecutive pullbacks. It is currently consolidating around 79,399 with an amplitude of 0.12%, which is a narrow-range oscillation.
This round started from 77,600. Along the way, there were two instances of surge followed by a pullback. MA7 (79,466.1) is currently running below MA25 (79,897.7). The short-term moving averages have not yet managed to regain the medium-term ones, leaving the price caught in a tug-of-war between them.
Technically, the outlook is weak: the MACD histogram is -99.1. The DIF line at -37.2 has fallen below the DEA line at 61.9, and momentum contraction is clearly evident. RSI6 is only 38.1, while RSI12 is 43.6—short-term pressure remains.
However, the derivatives market tells a different story. Open Interest is 107.68K contracts, with a notional value of $8.54 billion. Judging by the trend, Open Interest has been steadily rising and has not shrunk as price has pulled back. This combination of "price stalling higher while Open Interest increases" usually suggests that in-market capital is not withdrawing significantly; instead, it tends to imply turnover at higher levels rather than panic liquidation.
The super trend line at 80,603.6 is currently capping above the price. As long as it cannot reclaim this level, the probability of near-term range-bound consolidation is higher.
For personal opinion only and does not constitute investment advice.
#BTC #英伟达开盘140分钟成交335亿美元 #台股TAIEX受芯片股带动重返46500点 #ETH $ETH $NVDA
Current price 79,399.9, up 0.17% over the past 24 hours. The high touched 81,500.0, then followed by consecutive pullbacks. It is currently consolidating around 79,399 with an amplitude of 0.12%, which is a narrow-range oscillation.
This round started from 77,600. Along the way, there were two instances of surge followed by a pullback. MA7 (79,466.1) is currently running below MA25 (79,897.7). The short-term moving averages have not yet managed to regain the medium-term ones, leaving the price caught in a tug-of-war between them.
Technically, the outlook is weak: the MACD histogram is -99.1. The DIF line at -37.2 has fallen below the DEA line at 61.9, and momentum contraction is clearly evident. RSI6 is only 38.1, while RSI12 is 43.6—short-term pressure remains.
However, the derivatives market tells a different story. Open Interest is 107.68K contracts, with a notional value of $8.54 billion. Judging by the trend, Open Interest has been steadily rising and has not shrunk as price has pulled back. This combination of "price stalling higher while Open Interest increases" usually suggests that in-market capital is not withdrawing significantly; instead, it tends to imply turnover at higher levels rather than panic liquidation.
The super trend line at 80,603.6 is currently capping above the price. As long as it cannot reclaim this level, the probability of near-term range-bound consolidation is higher.
For personal opinion only and does not constitute investment advice.
#BTC #英伟达开盘140分钟成交335亿美元 #台股TAIEX受芯片股带动重返46500点 #ETH $ETH $NVDA
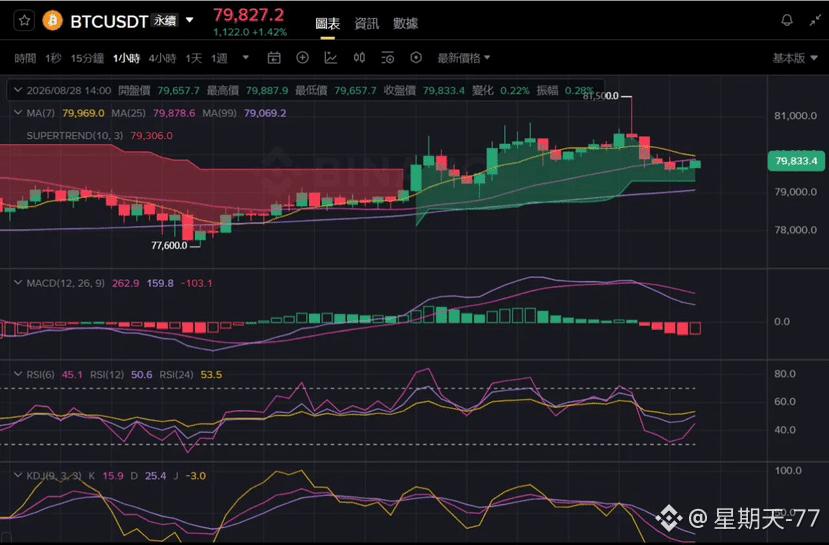
$BTC Consolidation continues. The KDJ has formed a dead cross
Current price: 79,827.2, up 1.42%. It topped at 81,500.0, then a single bearish candle quickly pulled back, breaking below the 80,000 integer level. It is currently hovering around 79,827.
The technical picture has turned clearly weaker: the KDJ has already formed a dead cross, with K at 15.9, D at 25.4, and J at -3.0. The MACD histogram has narrowed continuously from a high of 159.8 to -103.1; the green bars have turned red, and momentum confirmation suggests fading. RSI6 has also fallen to 45.1, hovering near neutral but slightly weak.
Price is currently sitting below the MA7 (79,969.0). It is ranging and tugging around the MA25 (79,878.6). The Super Trend line is at 79,306.0. As long as this level is not broken downward, the uptrend structure that started from 77,600 is still relatively intact—more like a strong consolidation rather than a trend reversal.
Based on the earlier analyst Ali Charts’ assessment, Bitcoin’s current movement may be forming a fractal structure similar to the late-2022 bottoming phase. The key resistance zone is around $83,000. This recent push upward has not yet reached that area. After the pullback, whether support can hold near 83,000 is worth ongoing observation.
Do you think this pullback is just a shakeout, or a sign of renewed weakness?
This is only my personal opinion and does not constitute investment advice.
#比特币守于7.94万美元 #BTC #WTI原油涨1.6%至84美元 #标普500涨0.7%科技板块涨3.3% $ETH $SOL
Current price: 79,827.2, up 1.42%. It topped at 81,500.0, then a single bearish candle quickly pulled back, breaking below the 80,000 integer level. It is currently hovering around 79,827.
The technical picture has turned clearly weaker: the KDJ has already formed a dead cross, with K at 15.9, D at 25.4, and J at -3.0. The MACD histogram has narrowed continuously from a high of 159.8 to -103.1; the green bars have turned red, and momentum confirmation suggests fading. RSI6 has also fallen to 45.1, hovering near neutral but slightly weak.
Price is currently sitting below the MA7 (79,969.0). It is ranging and tugging around the MA25 (79,878.6). The Super Trend line is at 79,306.0. As long as this level is not broken downward, the uptrend structure that started from 77,600 is still relatively intact—more like a strong consolidation rather than a trend reversal.
Based on the earlier analyst Ali Charts’ assessment, Bitcoin’s current movement may be forming a fractal structure similar to the late-2022 bottoming phase. The key resistance zone is around $83,000. This recent push upward has not yet reached that area. After the pullback, whether support can hold near 83,000 is worth ongoing observation.
Do you think this pullback is just a shakeout, or a sign of renewed weakness?
This is only my personal opinion and does not constitute investment advice.
#比特币守于7.94万美元 #BTC #WTI原油涨1.6%至84美元 #标普500涨0.7%科技板块涨3.3% $ETH $SOL
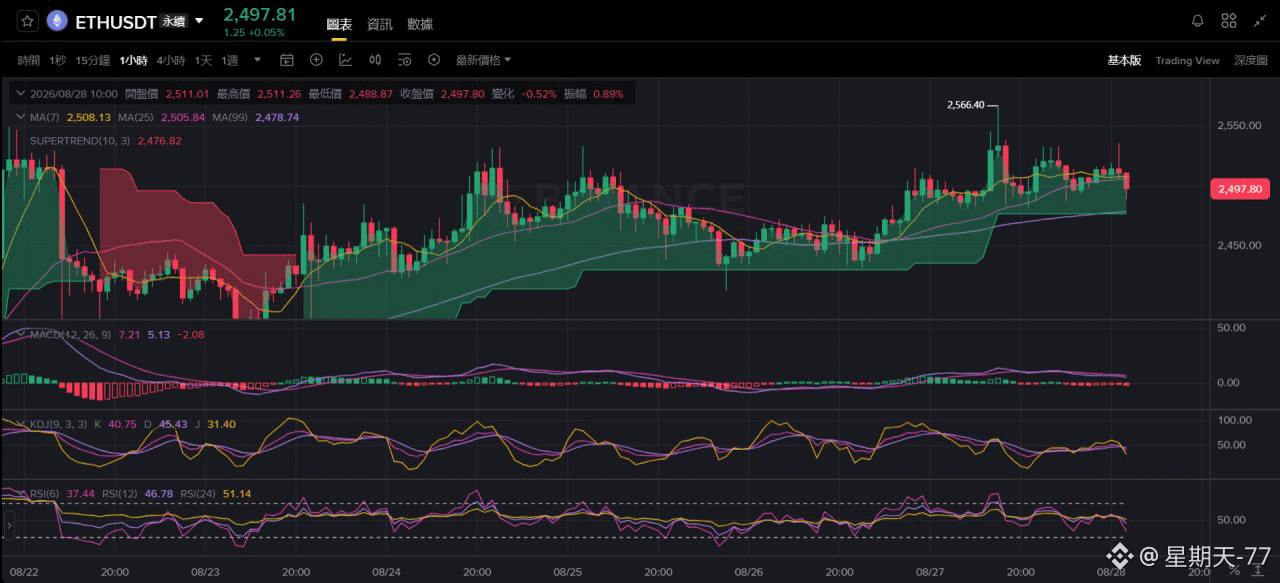
$ETH current price $2497.81, 24h change +0.05%. After spiking to 2566.40, it pulled back. The hourly chart has entered a high-range consolidation and pullback phase.
Indicator breakdown
• Moving Averages & Supertrend: MA7=2508.13, MA25=2505.84, MA99=2478.74; Supertrend support at 2476.82. The current price has fallen below the short-term moving average, raising near-term pressure. Supertrend and MA99 form a key support zone.
• MACD: MACD value 7.21, signal line 5.13, histogram difference -2.08. The red histogram is converging and weakening; bullish momentum is gradually fading, with potential signs of a death cross.
• KDJ: K=40.75, D=45.43, J=31.40. The three lines are diverging downward. A short-term pullback trend has started; it has not entered oversold yet, so there is still room to drop.
• RSI: RSI(6)=37.44, RSI(12)=46.78, RSI(24)=51.14. The short-cycle RSI is falling; bullish strength is weakening and price is in a neutral-to-weak range.
Market conclusion and trading reference
Upper resistance: previous high 2566.40, short-term moving average 2508;
Lower support: Supertrend 2476.82, MA99 at 2478.74.
After the spike, bullish momentum has weakened. On the hourly timeframe, a pullback-and-repair phase has started. The overall larger uptrend has not fully turned bad, but the short term is under pressure.
• No position: Don’t rush to bottom-fish. Wait for a pullback and watch for stabilization signals around the 2476–2478 support zone before considering any opportunity.
• In position: 2476 is an important line of defense. If it holds, you can continue to hold and bet on a rebound. If there is an effective breakdown of this level, it is recommended to reduce exposure to avoid the risk of further pullback.
This content is only a technical analysis interpretation and does not constitute investment advice.
#ETH #比特币升破8万美元创三月新高 #比特币守于7.94万美元 $SOL $BTC
Indicator breakdown
• Moving Averages & Supertrend: MA7=2508.13, MA25=2505.84, MA99=2478.74; Supertrend support at 2476.82. The current price has fallen below the short-term moving average, raising near-term pressure. Supertrend and MA99 form a key support zone.
• MACD: MACD value 7.21, signal line 5.13, histogram difference -2.08. The red histogram is converging and weakening; bullish momentum is gradually fading, with potential signs of a death cross.
• KDJ: K=40.75, D=45.43, J=31.40. The three lines are diverging downward. A short-term pullback trend has started; it has not entered oversold yet, so there is still room to drop.
• RSI: RSI(6)=37.44, RSI(12)=46.78, RSI(24)=51.14. The short-cycle RSI is falling; bullish strength is weakening and price is in a neutral-to-weak range.
Market conclusion and trading reference
Upper resistance: previous high 2566.40, short-term moving average 2508;
Lower support: Supertrend 2476.82, MA99 at 2478.74.
After the spike, bullish momentum has weakened. On the hourly timeframe, a pullback-and-repair phase has started. The overall larger uptrend has not fully turned bad, but the short term is under pressure.
• No position: Don’t rush to bottom-fish. Wait for a pullback and watch for stabilization signals around the 2476–2478 support zone before considering any opportunity.
• In position: 2476 is an important line of defense. If it holds, you can continue to hold and bet on a rebound. If there is an effective breakdown of this level, it is recommended to reduce exposure to avoid the risk of further pullback.
This content is only a technical analysis interpretation and does not constitute investment advice.
#ETH #比特币升破8万美元创三月新高 #比特币守于7.94万美元 $SOL $BTC
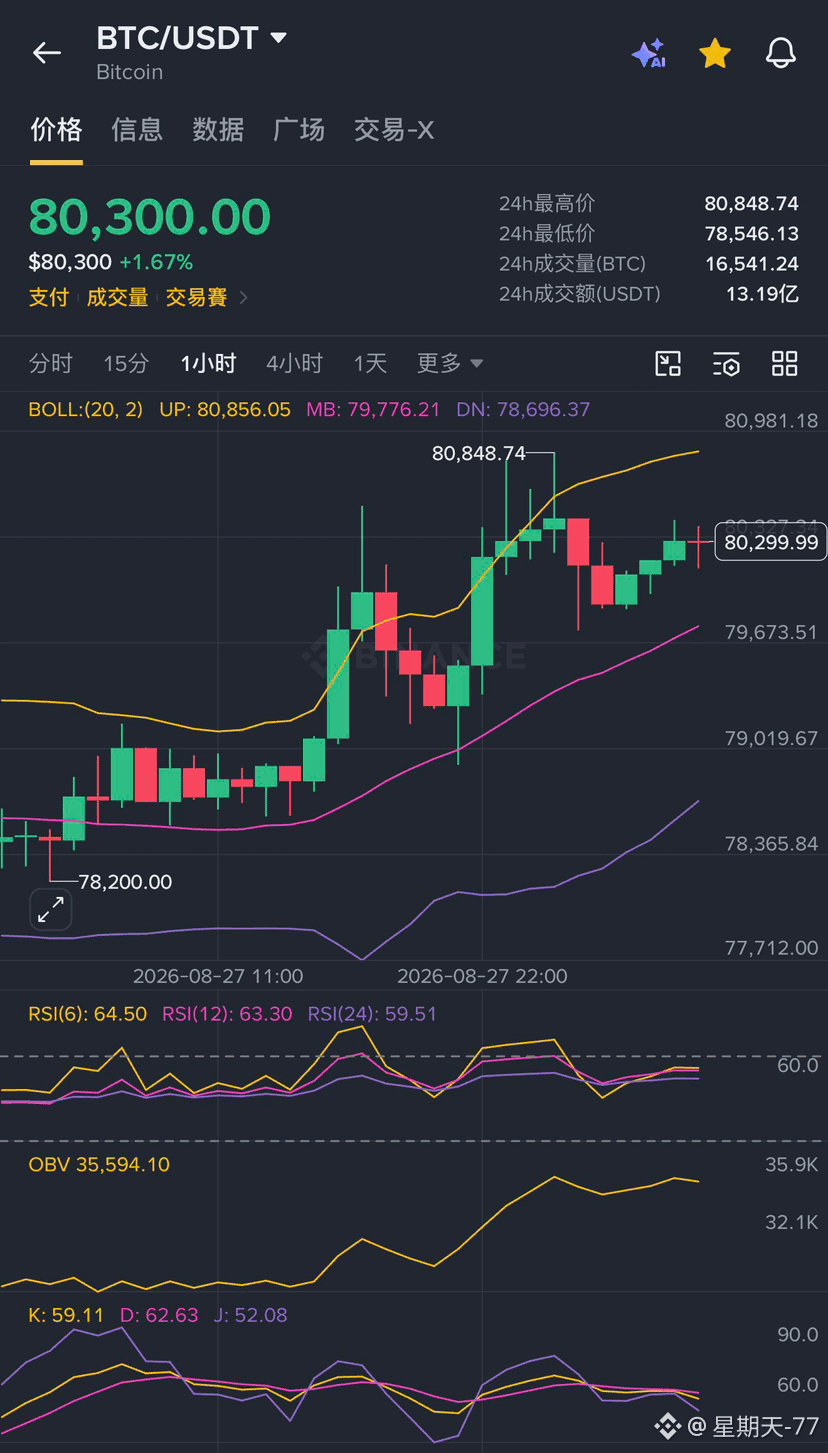
$BTC Holding steady at 80,000; after pushing up to 80,848 and then pulling back to consolidate
Current price: 80,300.00. In the past 24 hours it’s up 1.67%. The high reached 80,848.74, and the low was 78,546.13. Compared with the previous breakout above 80,000, this time the move is the second round of rally after the price has stabilized above 80,000—rising in a step-like climb from 78,200 up to 80,848, then pulling back moderately to where it is now, with no trend of rapidly dumping back below 80,000.
The technical picture is mildly neutral-to-strong: RSI(6) is 64.50. KDJ’s K value is 59.11 and J value is 52.08—both are in a neutral zone, with no overbought pressure. OBV has been climbing steadily to 35,594, indicating that this rally is supported by real trading volume rather than a fake spike. Price is holding above the BOLL middle band at 79,776.21, and the short-term structure remains bullish.
This movement matches what we discussed earlier from the HODL15Capital data: "there were lots of sell orders stacked near 80,000 that had been sitting for nearly a hundred days." Now the price has been trading above 80,000 for some time, suggesting some of those sell orders may be getting absorbed. However, around the upper band near 80,856 is still a key near-term level that needs to be broken through.
Do you think BTC can make a strong push and surge all the way up to 82,500, the thicker sell wall there?
For personal opinion only; not investment advice.
#btc #美元创近四周最大涨幅 #中国反对美国拟加征7.5%关税 #韩国央行加息25基点至3% $ETH $SOL
Current price: 80,300.00. In the past 24 hours it’s up 1.67%. The high reached 80,848.74, and the low was 78,546.13. Compared with the previous breakout above 80,000, this time the move is the second round of rally after the price has stabilized above 80,000—rising in a step-like climb from 78,200 up to 80,848, then pulling back moderately to where it is now, with no trend of rapidly dumping back below 80,000.
The technical picture is mildly neutral-to-strong: RSI(6) is 64.50. KDJ’s K value is 59.11 and J value is 52.08—both are in a neutral zone, with no overbought pressure. OBV has been climbing steadily to 35,594, indicating that this rally is supported by real trading volume rather than a fake spike. Price is holding above the BOLL middle band at 79,776.21, and the short-term structure remains bullish.
This movement matches what we discussed earlier from the HODL15Capital data: "there were lots of sell orders stacked near 80,000 that had been sitting for nearly a hundred days." Now the price has been trading above 80,000 for some time, suggesting some of those sell orders may be getting absorbed. However, around the upper band near 80,856 is still a key near-term level that needs to be broken through.
Do you think BTC can make a strong push and surge all the way up to 82,500, the thicker sell wall there?
For personal opinion only; not investment advice.
#btc #美元创近四周最大涨幅 #中国反对美国拟加征7.5%关税 #韩国央行加息25基点至3% $ETH $SOL
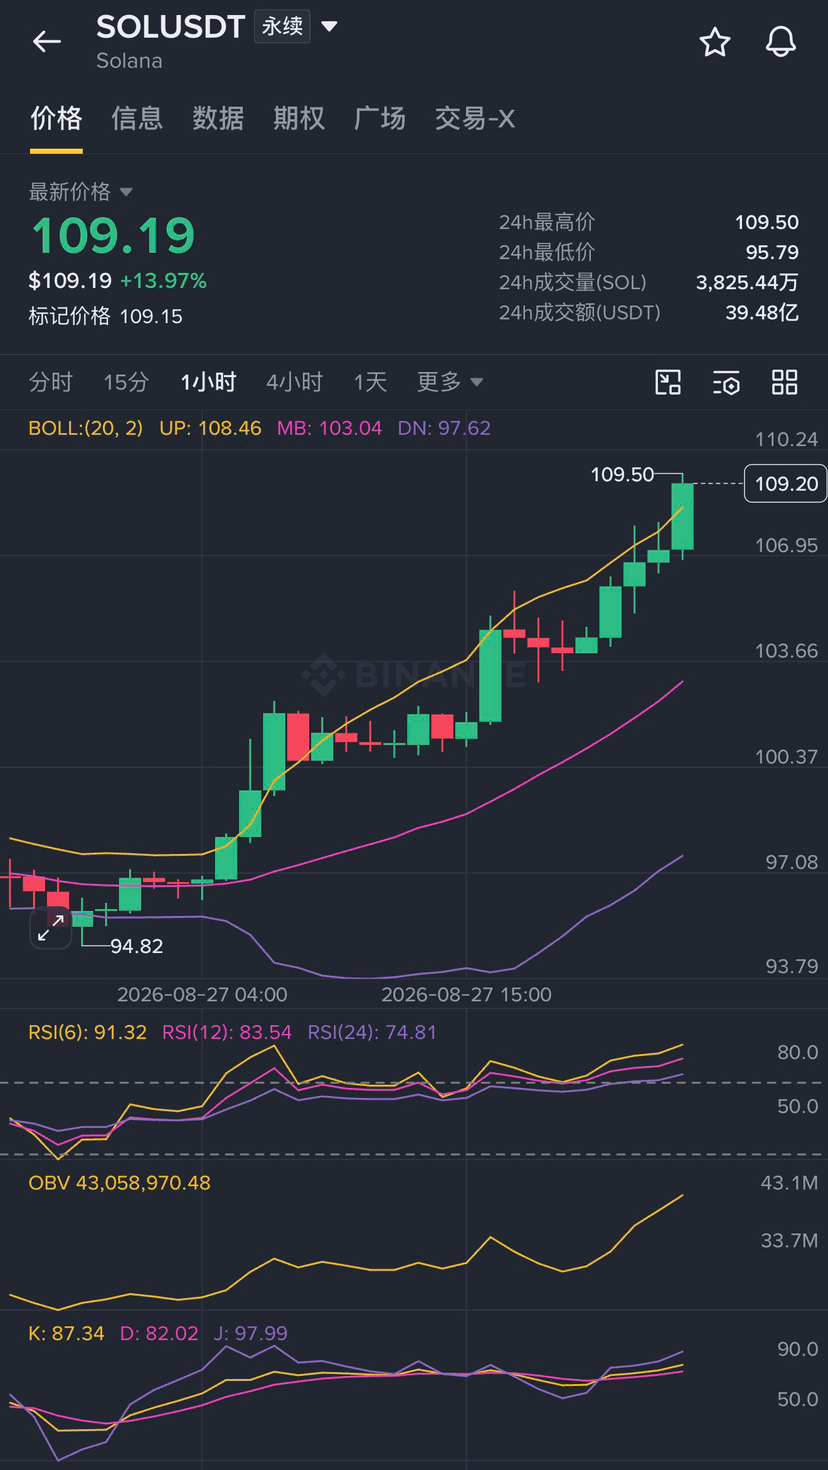
$SOL current price $109.19, 24h change +13.97%, 24h trading volume $3.948B (USDT). On an hourly timeframe, the uptrend remains strongly accelerated. The price holds above the upper Bollinger Band, and the momentum-driven bullish rally is continuing.
Indicator breakdown
• Bollinger Bands: Upper band 108.46, middle band 103.04, lower band 97.62. The price keeps breaking above the upper band; the channel has opened upward significantly. The upper band has turned into a short-term support level. The middle band at 103.04 is an important defense level for this leg up.
• RSI: RSI(6)=91.32, RSI(12)=83.54, RSI(24)=74.81. RSI-6 has entered the severe overbought zone. Bullish momentum is releasing at high levels, and the risk of a short-term pullback has increased significantly.
• OBV: OBV continues to make new highs. During the uptrend, volume keeps supporting the move, and buyers’ intent remains strong.
• KDJ: K=87.34, D=82.02, J=97.99. The J value is in an extremely overbought area. The indicator is seriously “flattened” (losing responsiveness), and a pullback/mean-reversion repair from a high level is possible at any time.
Market conclusion & trading reference
Resistance above: 24h high 109.50;
Supports below: 108.46 (upper Bollinger band), 103.04 (middle Bollinger band), 97.62 (lower Bollinger band).
The overall trend is clearly bullish, but short-term indicators are fully in severe overbought conditions, making the risk-reward of chasing very poor.
• No position: Do not chase. Wait for a pullback and digestion. Focus on reassessing opportunities after price stabilizes around 108.46 and 103.04.
• In position: Use the upper Bollinger band at 108.46 as the short-term defensive level. As long as it holds, you can continue to hold to bet on new highs. If there is an effective breakdown below it, it’s recommended to reduce exposure. Below, focus on the middle band area at 103.04.
This content is only a technical analysis interpretation and does not constitute investment advice.
#solana #sol #美元创近四周最大涨幅 #XRP领跌加密市场跌近7% $BTC $XRP
Indicator breakdown
• Bollinger Bands: Upper band 108.46, middle band 103.04, lower band 97.62. The price keeps breaking above the upper band; the channel has opened upward significantly. The upper band has turned into a short-term support level. The middle band at 103.04 is an important defense level for this leg up.
• RSI: RSI(6)=91.32, RSI(12)=83.54, RSI(24)=74.81. RSI-6 has entered the severe overbought zone. Bullish momentum is releasing at high levels, and the risk of a short-term pullback has increased significantly.
• OBV: OBV continues to make new highs. During the uptrend, volume keeps supporting the move, and buyers’ intent remains strong.
• KDJ: K=87.34, D=82.02, J=97.99. The J value is in an extremely overbought area. The indicator is seriously “flattened” (losing responsiveness), and a pullback/mean-reversion repair from a high level is possible at any time.
Market conclusion & trading reference
Resistance above: 24h high 109.50;
Supports below: 108.46 (upper Bollinger band), 103.04 (middle Bollinger band), 97.62 (lower Bollinger band).
The overall trend is clearly bullish, but short-term indicators are fully in severe overbought conditions, making the risk-reward of chasing very poor.
• No position: Do not chase. Wait for a pullback and digestion. Focus on reassessing opportunities after price stabilizes around 108.46 and 103.04.
• In position: Use the upper Bollinger band at 108.46 as the short-term defensive level. As long as it holds, you can continue to hold to bet on new highs. If there is an effective breakdown below it, it’s recommended to reduce exposure. Below, focus on the middle band area at 103.04.
This content is only a technical analysis interpretation and does not constitute investment advice.
#solana #sol #美元创近四周最大涨幅 #XRP领跌加密市场跌近7% $BTC $XRP
Log in to explore more content